
Build a Homelab Dashboard: Part 4, InfluxDB
Now that we have our foundation laid with a fresh installation of Debian and Organizr, we can now move on to the data collection portion of our dashboard. After all, we have to get the stats about our homelab before we can make them into pretty pictures. Before we can go get the stats, we need a place to put them. For this, we’ll be using the open source application InfluxDB. Before we dive in, let’s take a at the series so far:
- An Introduction
- Organizr
- Organizr Continued
- InfluxDB
- Telegraf Introduction
- Grafana Introduction
- pfSense
- FreeNAS
What is InfluxDB?
In part 1 of this series, I gave a brief overview of InfluxDB, but let’s dig a little deeper. At the very basic level, InfluxDB is a time-series database for storing events and statistics. The coolest part about InfluxDB is the HTTP interface that allows virtually anything to write to it. Over the next several posts we’ll see Telegraf, PowerShell, and Curl as potential clients to write back to InfluxDB. You can download InfluxDB directly from GitHub where it is updated very frequently. It supports authentication with multiple users and levels of security and of course multiple databases.
![]()
Installing InfluxDB
Installing InfluxDB is a pretty easy operation. We’ll start by logging into our Linux box using PuTTY:
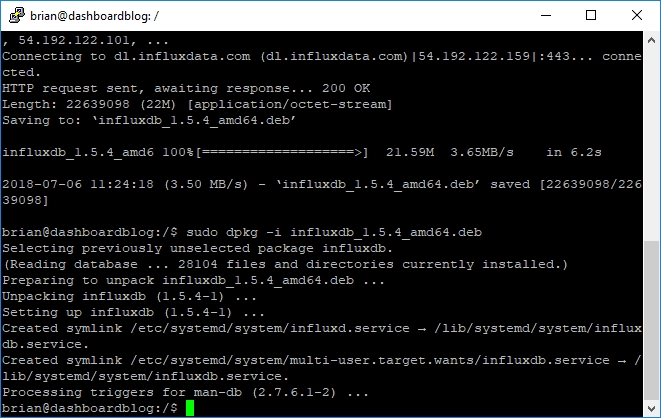
We’ll issue this command (be sure to check here for the latest download link):
sudo wget https://dl.influxdata.com/influxdb/releases/influxdb_1.5.4_amd64.deb
sudo dpkg -i influxdb_1.5.4_amd64.deb
The download and installation should look something like this:
Almost too easy, right? I think that’s the point! InfluxDB is meant to be completely dependency free. Let’s make sure everything really worked by enabling the service, starting the service, and checking the status of the service:
sudo systemctl enable influxdb
sudo systemctl start influxdb
systemctl status influxdb
If all went well, we should see that the service is active and running:
Configuring InfluxDB
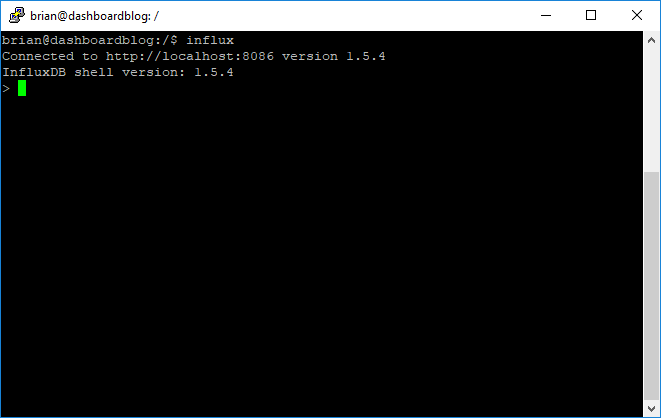
We’ll stay in PuTTY to complete much of our configuration. Start influx:
influx
This should start up our command line interface for InfluxDB:
Authentication
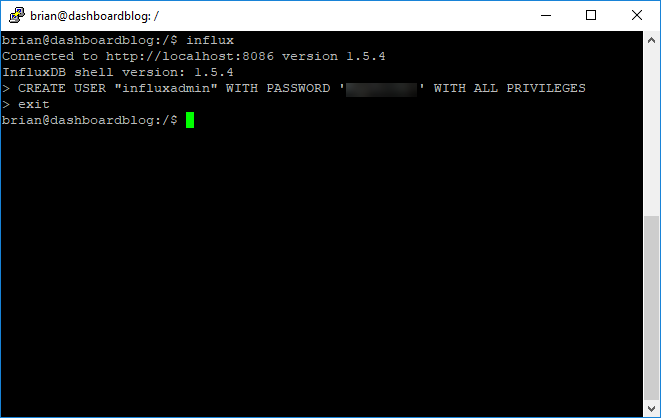
By default, InfluxDB does not require authentication. So let’s fix that by first creating an admin account so that we can enable authentication:
CREATE USER "influxadmin" WITH PASSWORD 'influxadminpassword' WITH ALL PRIVILEGES
exit
You’ll notice that it isn’t terribly verbose:
Once we have our user created, we should be ready to enable authentication. Let’s fire up nano and modify the configuration file:
sudo nano /etc/influxdb/influxdb.conf
Scroll through the file until you find the [http] section and set auth-enabled to true:
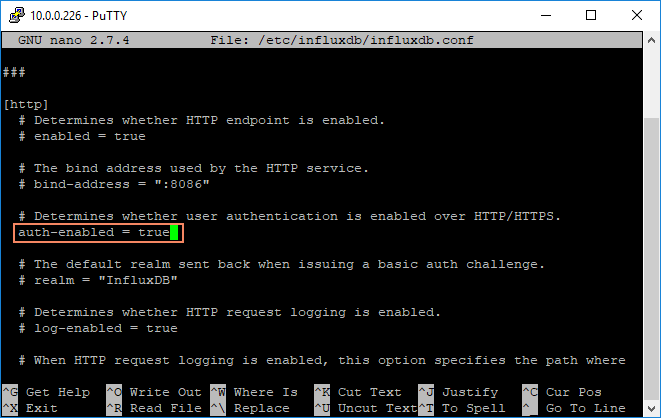
Write out the file with control-o and exit with control-x and you should be ready to restart the service:
sudo systemctl restart influxdb
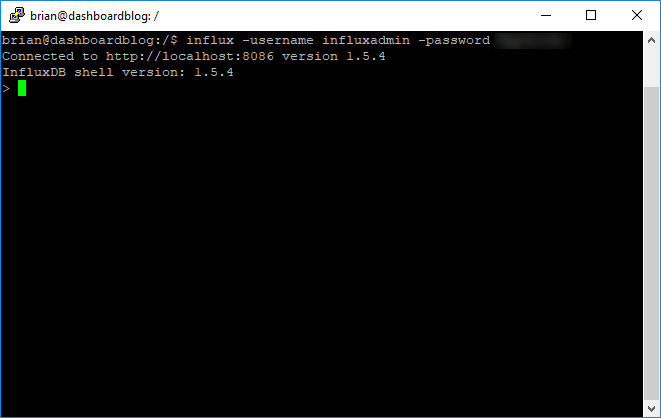
Now we can log back in using our newly created username and password to make sure that things work:
Create Databases
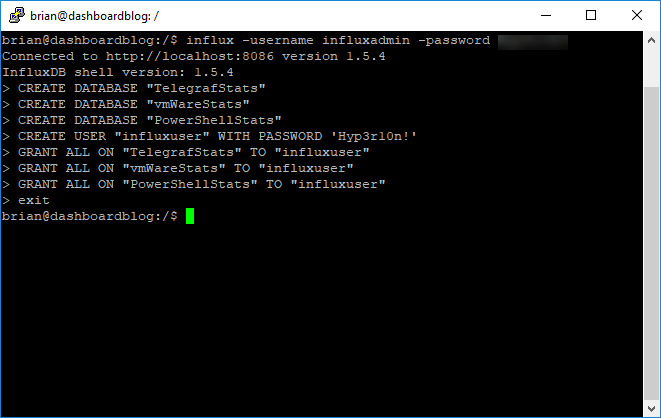
The final steps are to create a few databases finally a user to access them. You can just use the admin use you created, but generally its better to have a non-admin account:
CREATE DATABASE "TelegrafStats"
CREATE DATABASE "vmWareStats"
CREATE DATABASE "PowerShellStats"
I created three databases for my setup. One for use with Telegraf, one to store various vmWare specific metrics, and one for all of the random stuff I like to do with PowerShell. All of these will get their own set of blog posts in time.
Grant Permissions
Finally, we can create our user or users and grant access to the newly created databases:
CREATE USER "influxuser" WITH PASSWORD 'influxuserpassword'
GRANT ALL ON "TelegrafStats" TO "influxuser"
GRANT ALL ON "vmWareStats" TO "influxuser"
GRANT ALL ON "PowerShellStats" TO "influxuser"
Again…not terribly verbose:
Retention
By default, when you create a database in InfluxDB, it sets the retention to infinite. For me, being a digital packrat, this is exactly what I want. So I’m going to leave my configuration alone. But…for everyone else, you can find a guide on retention and downsampling here in the official InfluxDB documention. You can find the specific command details here.
Conclusion
That’s it! InfluxDB is now ready to receive information. In our next post, we’ll move on to Telegraf so that we can start sending it some data!
Version Update
When this blog post was written, InfluxDB 1.5.4 was the latest release. Before I was able to publish this blog post, InfluxDB 1.6 was released. Feel free to install that version instead of the version above:
sudo wget https://dl.influxdata.com/influxdb/releases/influxdb_1.6.0_amd64.deb
sudo dpkg -i influxdb_1.6.0_amd64.deb
Fun, thanks
Thanks man, looking forward to the rest of the series. Been waiting for a guide to follow to get Grafana etc up and running to monitor my home network!
Vcenter /Synology NAS/ Unifi Router / Unifi AP / Tautilli information would be amazing
Hey Man
Just wanted to leave a note to say thank you for this. I have been toying with the idea for awhile of installing Grafana and Organizr, great to see a guide for this finally!
Out of interest, are you able to post some information on populating grafana with info from the following?
Unifi Controller and AP/Router
VCenter
Synology NAS (including FTP)
Tautilli
Thanks Adam! My next post will focus on Telegraf and then Grafana. I plan to have a post on vCenter for sure. I don’t own a Synology, so it depends on what it uses for monitoring. If you can get it from SNMP, I plan to do an SNMP post with my UPS at some point, which may help. I will have FreeNAS and pfSense posts, as that’s what I use. I’ve not used Tautilli before, so doubtful on that one.
Good job, I also used InfluxDB, but i did not install it on my HW/VM because I am using corlysis.com
Did you install this on the same VM as Organizr, or a separate one?
This entire series lives on the Linux VM that I built at the beginning of the series. I may eventually migrate everything to a Raspberry Pi…in the distant future.