
Build a Homelab Dashboard: Part 5, Telegraf Introduction
As we continue on our homelab dashboard journey, we’re ready to start populating our time-series database (InfluxDB) with some actual data. To do this, we’ll start by installing Telegraf. But, before we dive in, let’s take a at the series so far:
- An Introduction
- Organizr
- Organizr Continued
- InfluxDB
- Telegraf Introduction
- Grafana Introduction
- pfSense
- FreeNAS
What is Telegraf
In part 1 of this series, I gave a brief overview of Telegraf, but as we did with InfluxDB in our last post, let’s dig a little deeper. Telegraf is a server agent designed to collect and report metrics. We’ll look at Telegraf from two perspectives. The first perspective is using Telegraf to gather statistics about the server on which it has been installed. This means that Telegraf will provide us data like CPU usage, memory usage, disk usage, and the like. It will take that data and send it over to our InfluxDB database for storage and reporting.

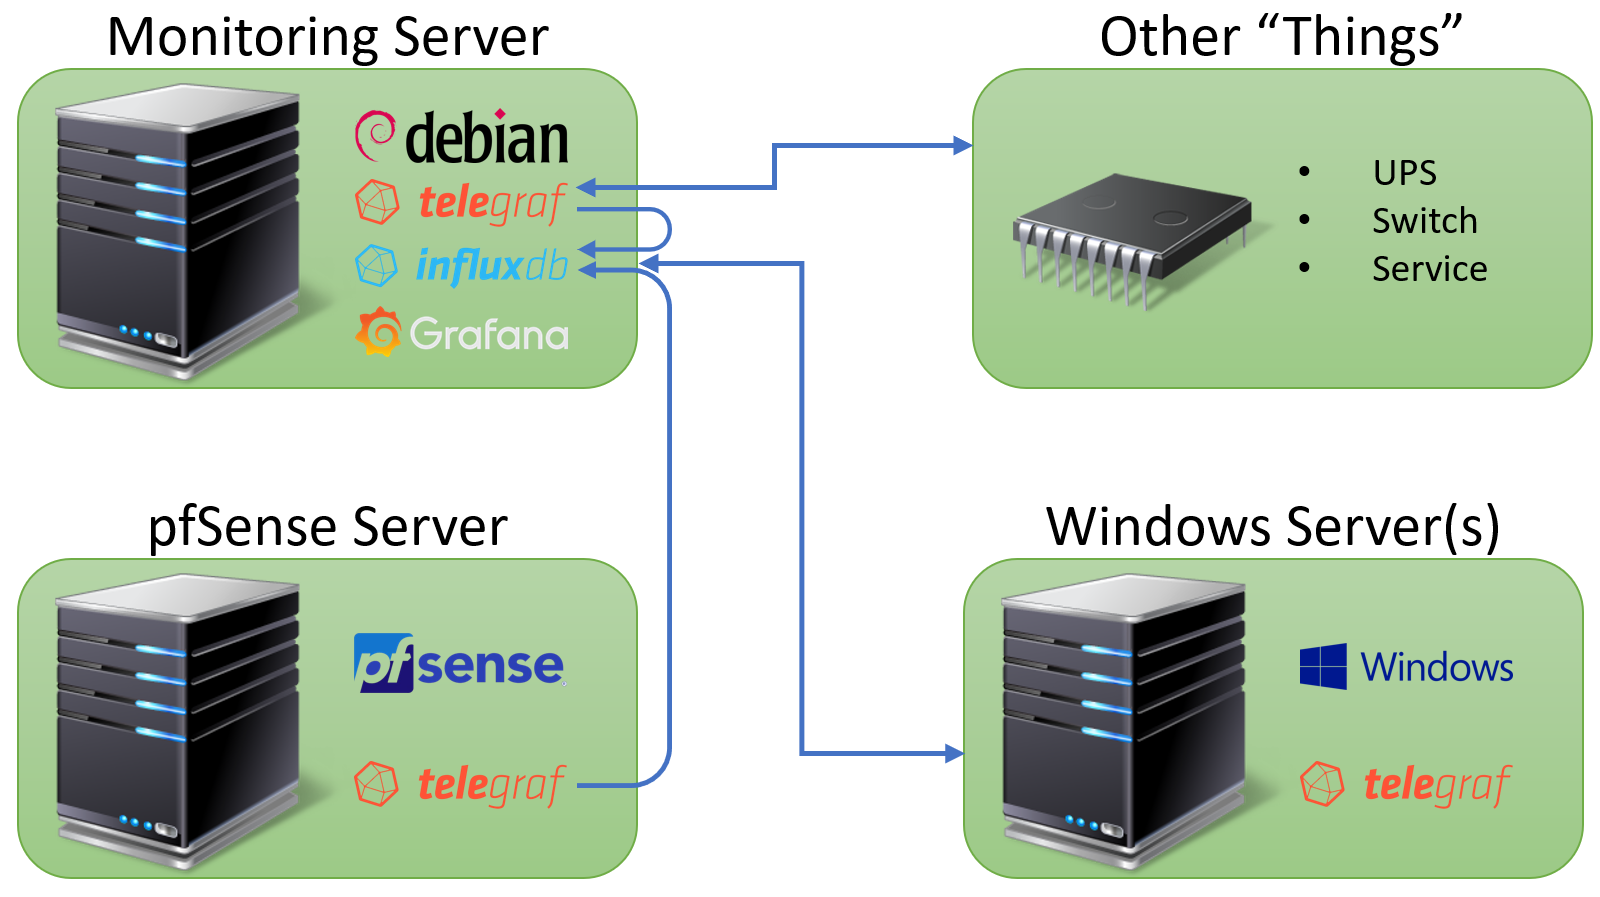
The second perspective is using Telegraf to connect to other external systems and services. For instance, we can use Telegraf to connect to a Supermicro system using IPMI or to a UPS using SNMP. Each of these sets of connectivity represents an input plugins The list of plugins is extensive and far too long to list. We’ll cover several of the plugins in future posts, but today we’ll focus the basics. Before we get into the installation, let’s take see what this setup looks like in the form of a diagram:

Looking at the diagram, we’ll see that we have our monitoring server with InfluxDB, Telegraf, and Grafana. Next we have a couple of examples of systems running the Telegraf agent on both Windows and FreeBSD. Finally, we have the other “things” box. This includes our other devices that Telegraf monitors without needing to actually be installed. The coolest part about Telegraf for my purposes is that it seems to work with almost everything in my lab. The biggest miss here is vmWare, which does not have a plugin yet. I’m hoping this changes in the future, but for now, we’ll find another way to handle vmWare.
Installing Telegraf on Linux
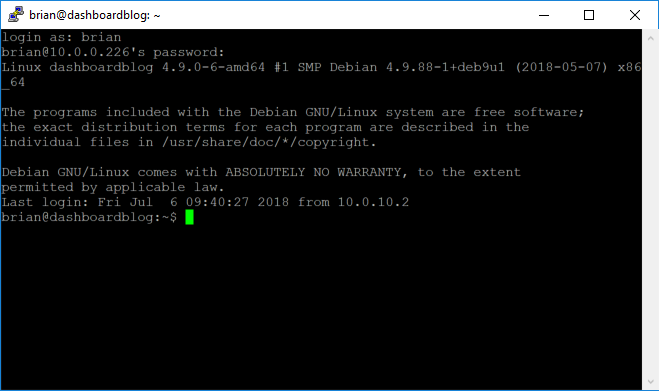
We’ll start by installing Telegraf onto our monitoring server that we started configuring way back in part 2 of this series. First we’ll log into our Linux box using PuTTY:
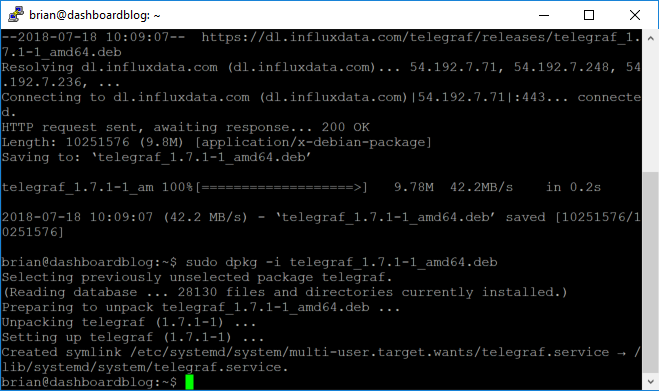
Next, we’ll download the software using the following commands:
sudo wget https://dl.influxdata.com/telegraf/releases/telegraf_1.7.1-1_amd64.deb
sudo dpkg -i telegraf_1.7.1-1_amd64.deb
The download and installation should look something like this:
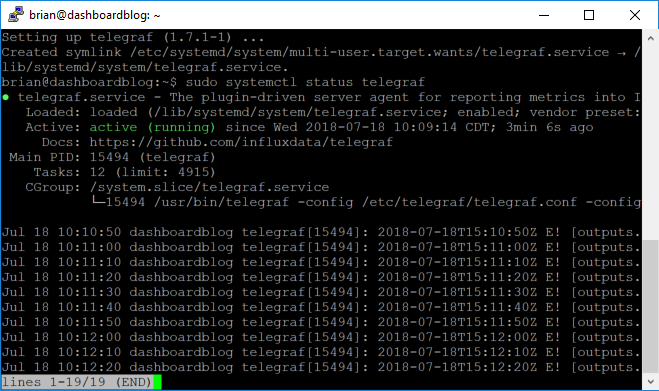
Much like our InfluxDB installation…incredibly easy. It’s actually even easier than InfluxDB in that the service should already be enabled and running. Let’s make sure:
sudo systemctl status telegraf
Assuming everything went well we should see “active (running)” in green:
Now that we have completed the installation, we can move on to configuration.
Configuring Telegraf
For the purposes of this part of the series, we’ll just get the basics set up. In future posts we’ll take a look at all of the more interesting things we can do. We’ll start our configuration by opening the config file in nano:
sudo nano /etc/telegraf/telegraf.conf
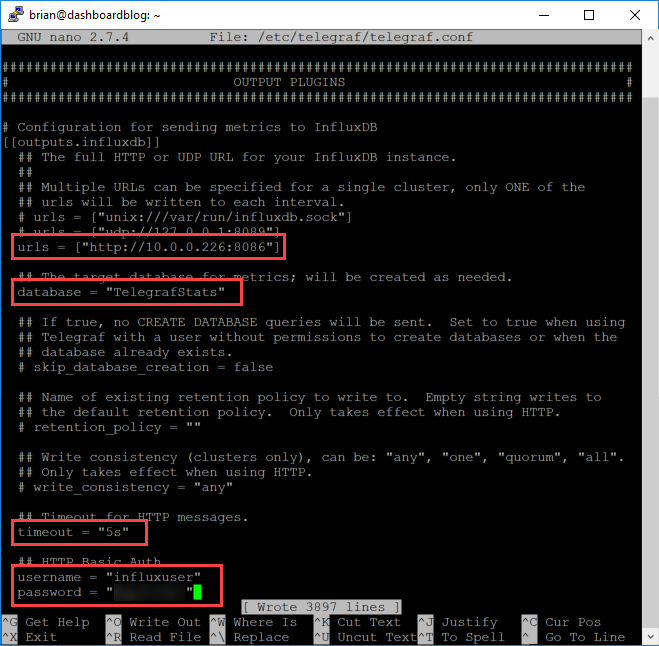
We mentioned input plugins earlier as it related to getting data, but now we’ll look at output plugins to send data to InfluxDB. We’ll uncomment and change the lines for urls, database, timeout, username, and password:
Save the file with Control-O and exit with Control X. Now we can restart the service so that our changes will take effect:
sudo systemctl restart telegraf
Now let’s log in to InfluxDB make sure we are getting data from Telegraf. We’ll use this command:
influx -username 'influxuser' -password 'influxuserpassword' -database 'TelegrafStats'
Once logged in, we can execute a command to see if we have any measurements:
SHOW MEASUREMENTS
This should all look something like this:
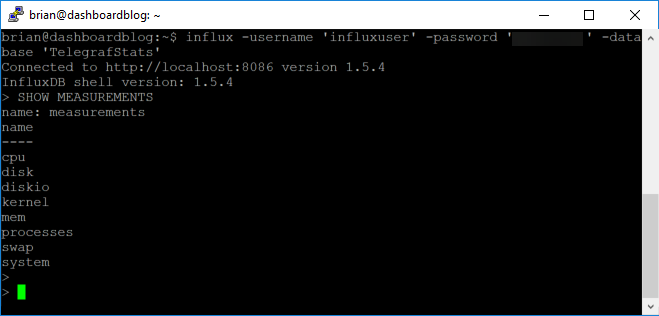
By default, the config file has settings ready to go for the following:
- CPU
- Disk
- Disk IO
- Kernel
- Memory
- Processes
- Swap
- System
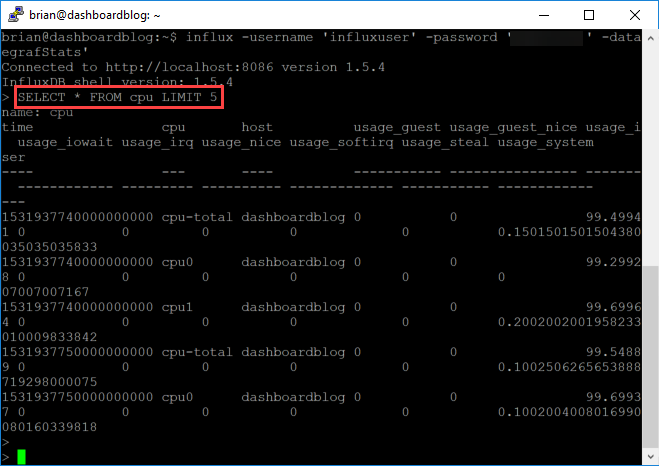
These will be metrics only for the system on which we just installed Telegraf. We can also take a look at the data just to get a look before we make it over to Grafana:
SELECT * FROM cpu LIMIT 5
This should show us 5 records from our cpu table:
Conclusion
With that, we have completed our configuration and will be ready to move on to visualizations using Grafana…in our next post.
Hey Man,
Thanks for the update. Just a question, when i get to the last part and run “SHOW MEASUREMENTS” nothing comes back, any ideas?
Hi Adam! I’m guessing you have either an authentication error or a database error. I would check your username and password and database in the conf file first. After that, check the logs in Telegraf.
Hmm no authentication error, it appears to login okay. Username and password all good. How do I check the Telegraf logs?
I had the same issue because in the Telegraf config file I mistyped the port number that Influxdb was listening on.
In the Telegraf config file, set debug to true and specify a log location, then check that log to see what the hangup is.
Had the same issue as Adam, however noticed that in the telegraph.conf screenshot (but not highlighted) that the database name was changed from the default of ‘telegraf’ to ‘TelegrafStats’. You also need to make that change, and then continue on with the rest of the instructions.
Then it works like a charm 🙂
Good catch. I’ll update my screenshot today or tonight.
And updated…thanks again.
Thanks Guys, that was it. The DB name was wrong
Hi,
In the screen capture just after SHOW MEASUREMENTS you forget to delete your password….
Thanks for the heads up. Luckily I don’t use that password for anything but stuff like this…just in case I make that mistake! Fixed!