
Build a Homelab Dashboard: Part 10 – SNMP and Telegraf
Last week we dug into IPMI. We started by getting IPMI working outside of Telegraf and then transitioned into Telegraf. This week we’ll start down the path of SNMP. This will likely not be the only post on SNMP and Telegraf, but it will be a good start. Before we dive in, as always, we’ll look at the series so far:
- An Introduction
- Organizr
- Organizr Continued
- InfluxDB
- Telegraf Introduction
- Grafana Introduction
- pfSense
- FreeNAS
- IPMI
- SNMP
What is SNMP?
Like IPMI, if you are reading this blog, you probably know about SNMP. But, you may also be like me in that you have never actually used SNMP. So for those of you that are like me, let’s start with a quick introduction. SNMP stands for Simple Network Management Protocol. This is essentially a standardized way to interface with network attached devices. SNMP is found other everything from switches, to printers, to hyper-visors, and beyond.
SNMP MIBs and OIDs
MIBs and OIDs are the building blocks of SNMP and are used to identify and organize information. MIB stands for stands for Management Information Base and is basically the magic decoder ring for the information provided by your device. The information provided by your device is actually stored using OIDs.
OID stands for Object Identifiers. OIDs are used to actually store the information that is translated by MIBs. OIDs are stored as a hierarchy and includes the entire string of parent OIDs. This will make a lot more sense once we get to our actual SNMP output.
Installing SNMP
Before we get started with SNMP and Telegraf, let’s start with just getting SNMP installed and working in our Debian Linux environment. This is a fairly easy process:
sudo apt-get install snmp
I can’t seem to find my screenshot of the completed installation, so use your imagination (or your eyes if you are doing your own installation right now). Once the installation has been completed, we can use one of the many utilities to provide us with an SNMP walk. This will essentially provide us with the entire set of OIDs and values to take a look at. Here’s the command:
snmpwalk -v 2c -c public 10.0.0.8 > snmpwalkX1052.txt
The command snmpwalk requires a version (-v), a community (-c), and an address. I’ve also decided to dump this to a text file as my switch spit out a ton of information. I’m using 2c as my version, public as my community, and 10.0.0.8 as my device address. If we open the text file, we’ll see a whole lot of
iso.3.6.1.2.1.1.1.0 = STRING: "Dell Networking X1052 1-10Gb Switch"
iso.3.6.1.2.1.1.2.0 = OID: iso.3.6.1.4.1.674.10895.3073
iso.3.6.1.2.1.1.3.0 = Timeticks: (3325115100) 384 days, 20:25:51.00
iso.3.6.1.2.1.1.4.0 = ""
iso.3.6.1.2.1.1.5.0 = ""
iso.3.6.1.2.1.1.6.0 = ""
iso.3.6.1.2.1.1.7.0 = INTEGER: 6
iso.3.6.1.2.1.1.8.0 = Timeticks: (0) 0:00:00.00
iso.3.6.1.2.1.1.9.1.2.1 = OID: iso.3.6.1.4.1.89.73
iso.3.6.1.2.1.1.9.1.3.1 = STRING: "RS capabilities"
iso.3.6.1.2.1.1.9.1.4.1 = Timeticks: (0) 0:00:00.00
iso.3.6.1.2.1.2.1.0 = INTEGER: 65
iso.3.6.1.2.1.2.2.1.1.1 = INTEGER: 1
iso.3.6.1.2.1.2.2.1.1.2 = INTEGER: 2
iso.3.6.1.2.1.2.2.1.1.3 = INTEGER: 3
iso.3.6.1.2.1.2.2.1.1.4 = INTEGER: 4
iso.3.6.1.2.1.2.2.1.1.5 = INTEGER: 5
iso.3.6.1.2.1.2.2.1.1.6 = INTEGER: 6
iso.3.6.1.2.1.2.2.1.1.7 = INTEGER: 7
iso.3.6.1.2.1.2.2.1.1.8 = INTEGER: 8
iso.3.6.1.2.1.2.2.1.1.9 = INTEGER: 9
iso.3.6.1.2.1.2.2.1.1.10 = INTEGER: 10
Well…that’s not terribly helpful. At least it didn’t seem helpful to me. After some more research and help from the /r/Homelab community, I was able to figure it out. I needed to install the snmp-mibs-downloader. This utility magically downloads the proper MIBs and allows enables the snmpwalk utility to translate the above into something we can actually understand.
Installing snmp-mibs-downloader
This is install that should be really easy, and maybe for someone with more Linux experience, it would be a breeze. But…it took me a minute to figure it out. Let’s start with the basic install command:
sudo apt-get install snmp-mibs-downloader
If you have a basic installation of Debian like I do, you will see something like this:
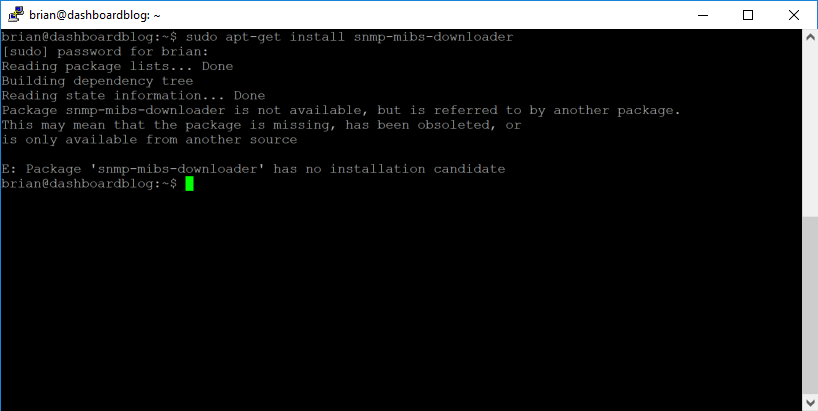
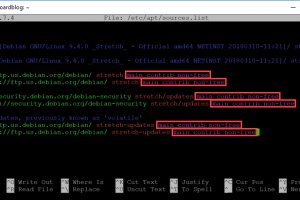
In short, this means that you haven’t yet enabled “non-free” sources. Now…I was thinking non-free meant that I would eventually need to buy something, but in this case, it doesn’t. It just means you need to modify your APT sources and update so that the package will be available for installation. So let’s open the sources.list:
sudo pico /etc/apt/sources.list
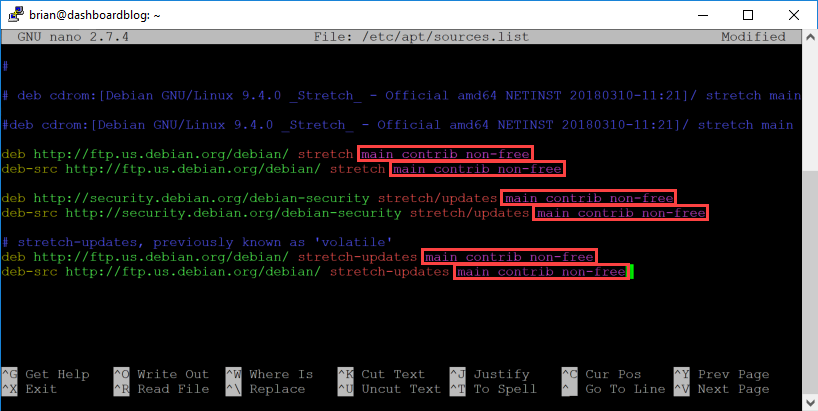
Basically add the following code as you see above:
contrib non-free
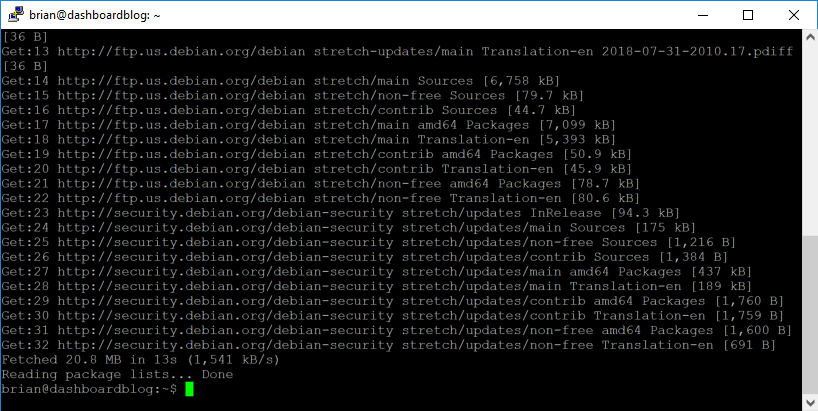
Once you save your changes you can then run an update:
sudo apt-get update
This should look something like this:
Now we can run our installation again:
sudo apt-get install snmp-mibs-downloader
And this should look a little better:
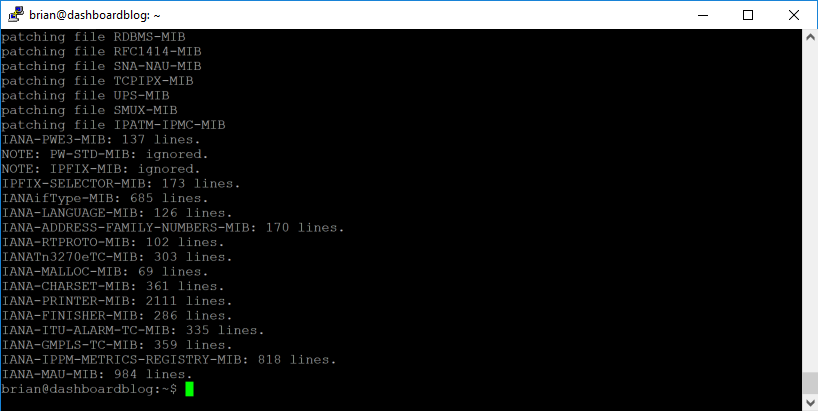
But wait…we still aren’t quite done. We have to actually enable downloading (which is disabled by default):
sudo pico /etc/snmp/snmp.conf
And we simply comment mibs out:
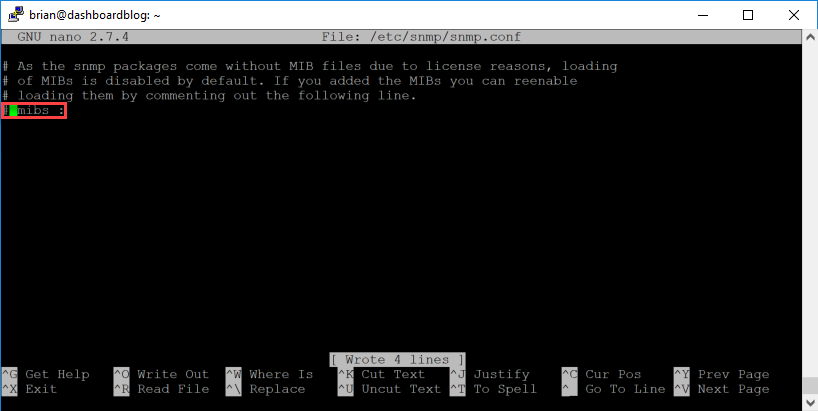
As the comments in the file say, this will enable downloading and we can test out our snmp walk command one more time:
snmpwalk -v 2c -c public 10.0.0.8 > snmpwalkX1052-mib.txt
Now let’s take a look at our file:
SNMPv2-MIB::sysDescr.0 = STRING: Dell Networking X1052 1-10Gb Switch
SNMPv2-MIB::sysObjectID.0 = OID: SNMPv2-SMI::enterprises.674.10895.3073
DISMAN-EVENT-MIB::sysUpTimeInstance = Timeticks: (3333306000) 385 days, 19:11:00.00
SNMPv2-MIB::sysContact.0 = STRING:
SNMPv2-MIB::sysName.0 = STRING:
SNMPv2-MIB::sysLocation.0 = STRING:
SNMPv2-MIB::sysServices.0 = INTEGER: 6
SNMPv2-MIB::sysORLastChange.0 = Timeticks: (0) 0:00:00.00
SNMPv2-MIB::sysORID.1 = OID: SNMPv2-SMI::enterprises.89.73
SNMPv2-MIB::sysORDescr.1 = STRING: RS capabilities
SNMPv2-MIB::sysORUpTime.1 = Timeticks: (0) 0:00:00.00
IF-MIB::ifNumber.0 = INTEGER: 65
IF-MIB::ifIndex.1 = INTEGER: 1
IF-MIB::ifIndex.2 = INTEGER: 2
IF-MIB::ifIndex.3 = INTEGER: 3
IF-MIB::ifIndex.4 = INTEGER: 4
IF-MIB::ifIndex.5 = INTEGER: 5
IF-MIB::ifIndex.6 = INTEGER: 6
IF-MIB::ifIndex.7 = INTEGER: 7
IF-MIB::ifIndex.8 = INTEGER: 8
IF-MIB::ifIndex.9 = INTEGER: 9
IF-MIB::ifIndex.10 = INTEGER: 10
That seems a little more usable! Now we can move on to using SNMP and Telegraf.
SNMP and Telegraf
We now have SNMP working…but what about Telegraf? I found a great guide here by Lindsay Hill. He covers a lot of what I’m going to cover, but doesn’t provide as much detailed explanation as I would like. Again, he did a fantastic job, I’m just going to build on the foundation that he provided. So let’s start with our Telegraf config. If we look here, we’ll see a sample SNMP configuration setup for a switch. Let’s take a look at the config sample:
[[inputs.snmp]]
  agents = [ "host.example.com" ]
  version = 2
  community = "public"

  [[inputs.snmp.field]]
    name = "hostname"
    oid = "RFC1213-MIB::sysName.0"
    is_tag = true

  [[inputs.snmp.field]]
    name = "uptime"
    oid = "DISMAN-EXPRESSION-MIB::sysUpTimeInstance"

  # IF-MIB::ifTable contains counters on input and output traffic as well as errors and discards.
  [[inputs.snmp.table]]
    name = "interface"
    inherit_tags = [ "hostname" ]
    oid = "IF-MIB::ifTable"

    # Interface tag - used to identify interface in metrics database
    [[inputs.snmp.table.field]]
      name = "ifDescr"
      oid = "IF-MIB::ifDescr"
      is_tag = true

  # IF-MIB::ifXTable contains newer High Capacity (HC) counters that do not overflow as fast for a few of the ifTable counters
  [[inputs.snmp.table]]
    name = "interface"
    inherit_tags = [ "hostname" ]
    oid = "IF-MIB::ifXTable"

    # Interface tag - used to identify interface in metrics database
    [[inputs.snmp.table.field]]
      name = "ifDescr"
      oid = "IF-MIB::ifDescr"
      is_tag = true

  # EtherLike-MIB::dot3StatsTable contains detailed ethernet-level information about what kind of errors have been logged on an interface (such as FCS error, frame too long, etc)
  [[inputs.snmp.table]]
    name = "interface"
    inherit_tags = [ "hostname" ]
    oid = "EtherLike-MIB::dot3StatsTable"

    # Interface tag - used to identify interface in metrics database
    [[inputs.snmp.table.field]]
      name = "ifDescr"
      oid = "IF-MIB::ifDescr"
      is_tag = true
I opened up my snmpwalk output and compared the sample to what my device seemed to use and made a few modifications:
[[inputs.snmp]]
  agents = [ "10.0.0.8" ]
  version = 2
  community = "public"
  interval = "60s"

  [[inputs.snmp.field]]
    name = "hostname"
    oid = "SNMPv2-MIB::sysName.0"
    is_tag = true

  [[inputs.snmp.field]]
    name = "uptime"
    oid = "DISMAN-EVENT-MIB::sysUpTimeInstance"

  # IF-MIB::ifTable contains counters on input and output traffic as well as errors and discards.
  [[inputs.snmp.table]]
    name = "interface"
    inherit_tags = [ "hostname" ]
    oid = "IF-MIB::ifTable"

    # Interface tag - used to identify interface in metrics database
    [[inputs.snmp.table.field]]
      name = "ifDescr"
      oid = "IF-MIB::ifDescr"
      is_tag = true

  # IF-MIB::ifXTable contains newer High Capacity (HC) counters that do not overflow as fast for a few of the ifTable counters
  [[inputs.snmp.table]]
    name = "interface"
    inherit_tags = [ "hostname" ]
    oid = "IF-MIB::ifXTable"

    # Interface tag - used to identify interface in metrics database
    [[inputs.snmp.table.field]]
      name = "ifDescr"
      oid = "IF-MIB::ifDescr"
      is_tag = true

  # EtherLike-MIB::dot3StatsTable contains detailed ethernet-level information about what kind of errors have been logged on an interface (such as FCS error, frame too long, etc)
  [[inputs.snmp.table]]
    name = "interface"
    inherit_tags = [ "hostname" ]
    oid = "EtherLike-MIB::dot3StatsTable"

    # Interface tag - used to identify interface in metrics database
    [[inputs.snmp.table.field]]
      name = "ifDescr"
      oid = "IF-MIB::ifDescr"
      is_tag = true
My changes were pretty straight forward based on my snmpwalk results:
- The hostname field: replaced RFC1213-MIB with SNMPv2-MIB
- The uptime field: replaced DISMAN-EXPRESSION-MIB with DISMAN-EVENT-MIB
We’ll open our Telegraf config file and make the changes:
sudo pico /etc/telegraf/telegraf.conf
And as usual, restart our service:
sudo systemctl restart telegraf
Assuming things have gone well, we can move on to Grafana.
SNMP and Grafana
Metrics
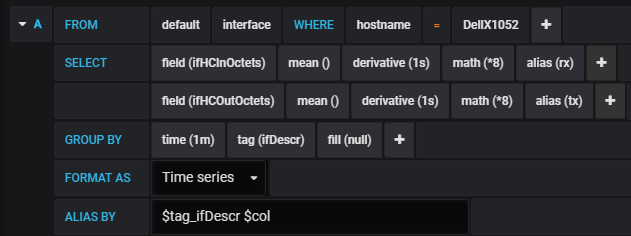
Let’s take a look at the final query:
 Let’s break it down piece by piece (again credit to Lindsay Hill for providing a great example on this):
From
- We have selected interface
Where
- We have selected DellX1052 (the hostname of my switch).
- If your device doesn’t have a hostname specified, you can select agent_host
Select
- We have selected the ifHCInOctets. This is a 64-bit value found in the ifXTable. Be sure not to select ifInOctets, as this is a 32-bit value. With fast interfaces (gigabit and above), this overflows to rapidly and will result in massive positive and negative values when using the derivative function.
- Speaking of the derative function, we use that function with a parameter of 1s. As I’ve discussed in a prior post, this take the difference between values in our values over time. If we don’t use this function, we’ll have an ever increasing graph.
- We also need to use the math function with a parameter of *8 so that we can convert our ifHCInOctets value to bits.
- Finally, we use the alias function with a parameter of rx. This is essentially a name for our column which we will reference later.
Group By
- The group by on time is set to 1m to line up with our interval of 60s.
- We added a tag of ifDescr as well. If we look at the config above, we’ll see that we have added the tag to our metric. This tag will contain the text description of our ports in this instance. By adding this, all of our ports will have their own series on the graph.
Alias By
- We use our Alias By to name our metrics. This will appear in the legend. We are using two variables to form our name.
- $tag_ifDescr references the tag of ifDescr and adds it to our alias.
- $col references the name of the column. Because we added an alias to our columns, it will use that alias. In this example, our port description is concatenated with our field alias.
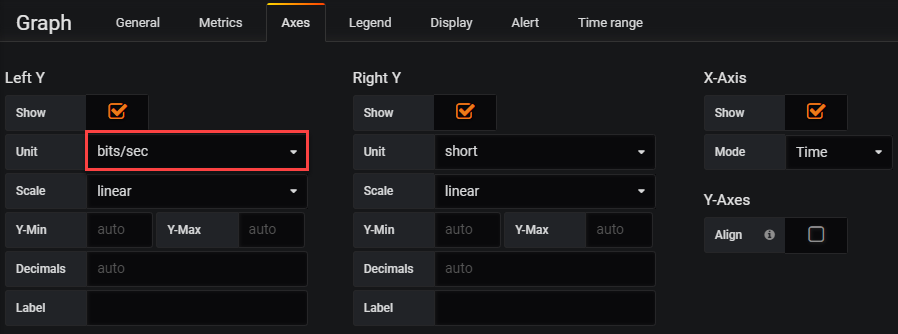
Axes
In our axes settings, we’ve changed our units to bits per second:
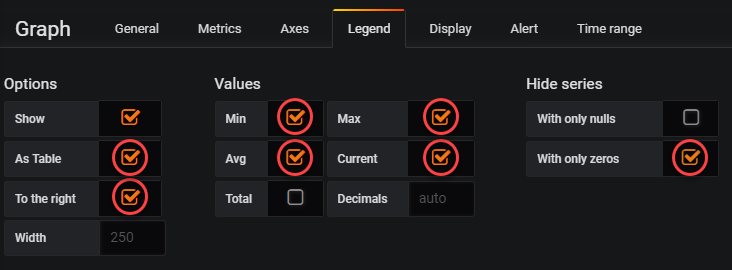
Legend
Our legend settings will be mostly the same as always…a table. But…we have couple of new items here. First, we can suppress columns with only zeros. This is great, as we don’t have to see all of our inactive ports. Second, we can move our legend to the right. Why? Because this could be a pretty big list, so we get a little more real estate. Here are the settings:
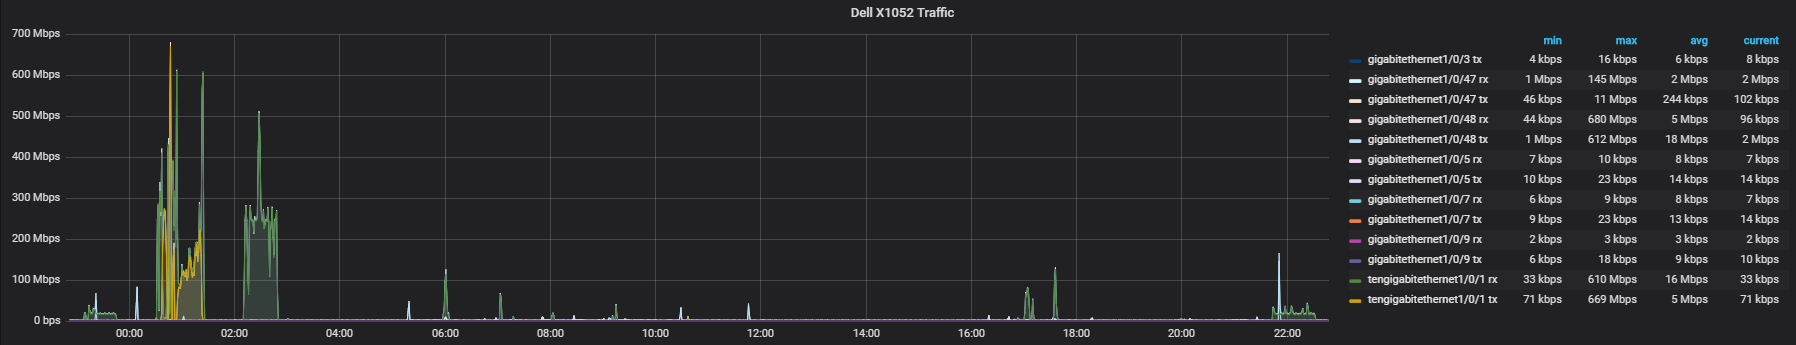
The Graph
Now let’s take a look at the fruits of our labor!
Conclusion
I’ll be revisiting SNMP with other device types as today was heavily skewed towards a switch. SNMP can be used with things like vmWare and managed UPS’s as well. In the meantime, hopefully this was helpful!
Thanks for creating this series, this is really helping me with my new lab. Regarding SNMP, I’ve taken this and got the same graph working, CPU, Memory of my router.
I’m now trying to get the TCP-MIB/UDP-MIB’s working so I can use a worldmap to map traffic, but the following in telegraf doesn’t work. Perhaps you’ve already solved this yourself?
[[inputs.snmp.table]]
name = “interface”
inherit_tags = [ “host” ]
oid = “TCP-MIB::tcpConnectionTable”
# Interface tag – used to identify interface in metrics database
[[inputs.snmp.table.field]]
name = “ifDescr”
oid = “IF-MIB::ifDescr”
is_tag = true
[[inputs.snmp.table]]
name = “interface”
inherit_tags = [ “host” ]
oid = “UDP-MIB::udpEndpointTable”
# Interface tag – used to identify interface in metrics database
[[inputs.snmp.table.field]]
name = “ifDescr”
oid = “IF-MIB::ifDescr”
is_tag = true
I used the articles at http://net-snmp.sourceforge.net/docs/mibs/tcp.html#tcpConnectionTable and http://net-snmp.sourceforge.net/docs/mibs/udp.html#udpEndpointTable in my research on this.
I had to tweak my configuration to match up with the actual field names coming out of my switch’s SNMP tables. I would look closely at the output from the snmp tools and make sure the names are correct. I had to adjust several.