
Build a Homelab Dashboard: Part 1, An Introduction
If you’ve read much of my blog, you know at this point that I like to create “series” of blog posts. Welcome to the latest addition. The topic of this extremely long series? Homelab Dashboards. So what is a homelab dashboard? If you don’t know the answer to this question, you will likely not enjoy the rest of this series…but just in case, I’ll give a brief description and then we’ll get started into some of the technologies that I have used and will demonstrate. A homelab dashboard is quite simply a dashboard that provides a nice interface to your homelab and all of the things you want to know about your homelab. So…if you don’t have a homelab, either build one, or probably ignore this series! The series as of now:
- An Introduction
- Organizr
- Organizr Continued
- InfluxDB
- Telegraf Introduction
- Grafana Introduction
- pfSense
- FreeNAS
Homelab Dashboards
I’m going to cover a variety of technologies that make up a homelab dashboard in this series. You have all of the back-end plumbing that provides information for your dashboard, you have the dashboard itself, and generally some other interface to put it all together. Let’s start and the end and work our way back to the beginning. I like having a place to see all of my statistics and status information, but I also like having a single landing zone to get to all of my interfaces. For me, this might be pfSense, FreeNAS, my Hyperion environments, or any number of other things I go to many times a day. For this, I need more than just a pretty set of graphs. I started off going through a list of dashboards on /r/homelab to see what other people were using. You can see a list here of a variety of homelab dashboards. As I went through this list, the author of this post had a nice custom dashboard that was easy to modify and easy on the eyes. So I started there:
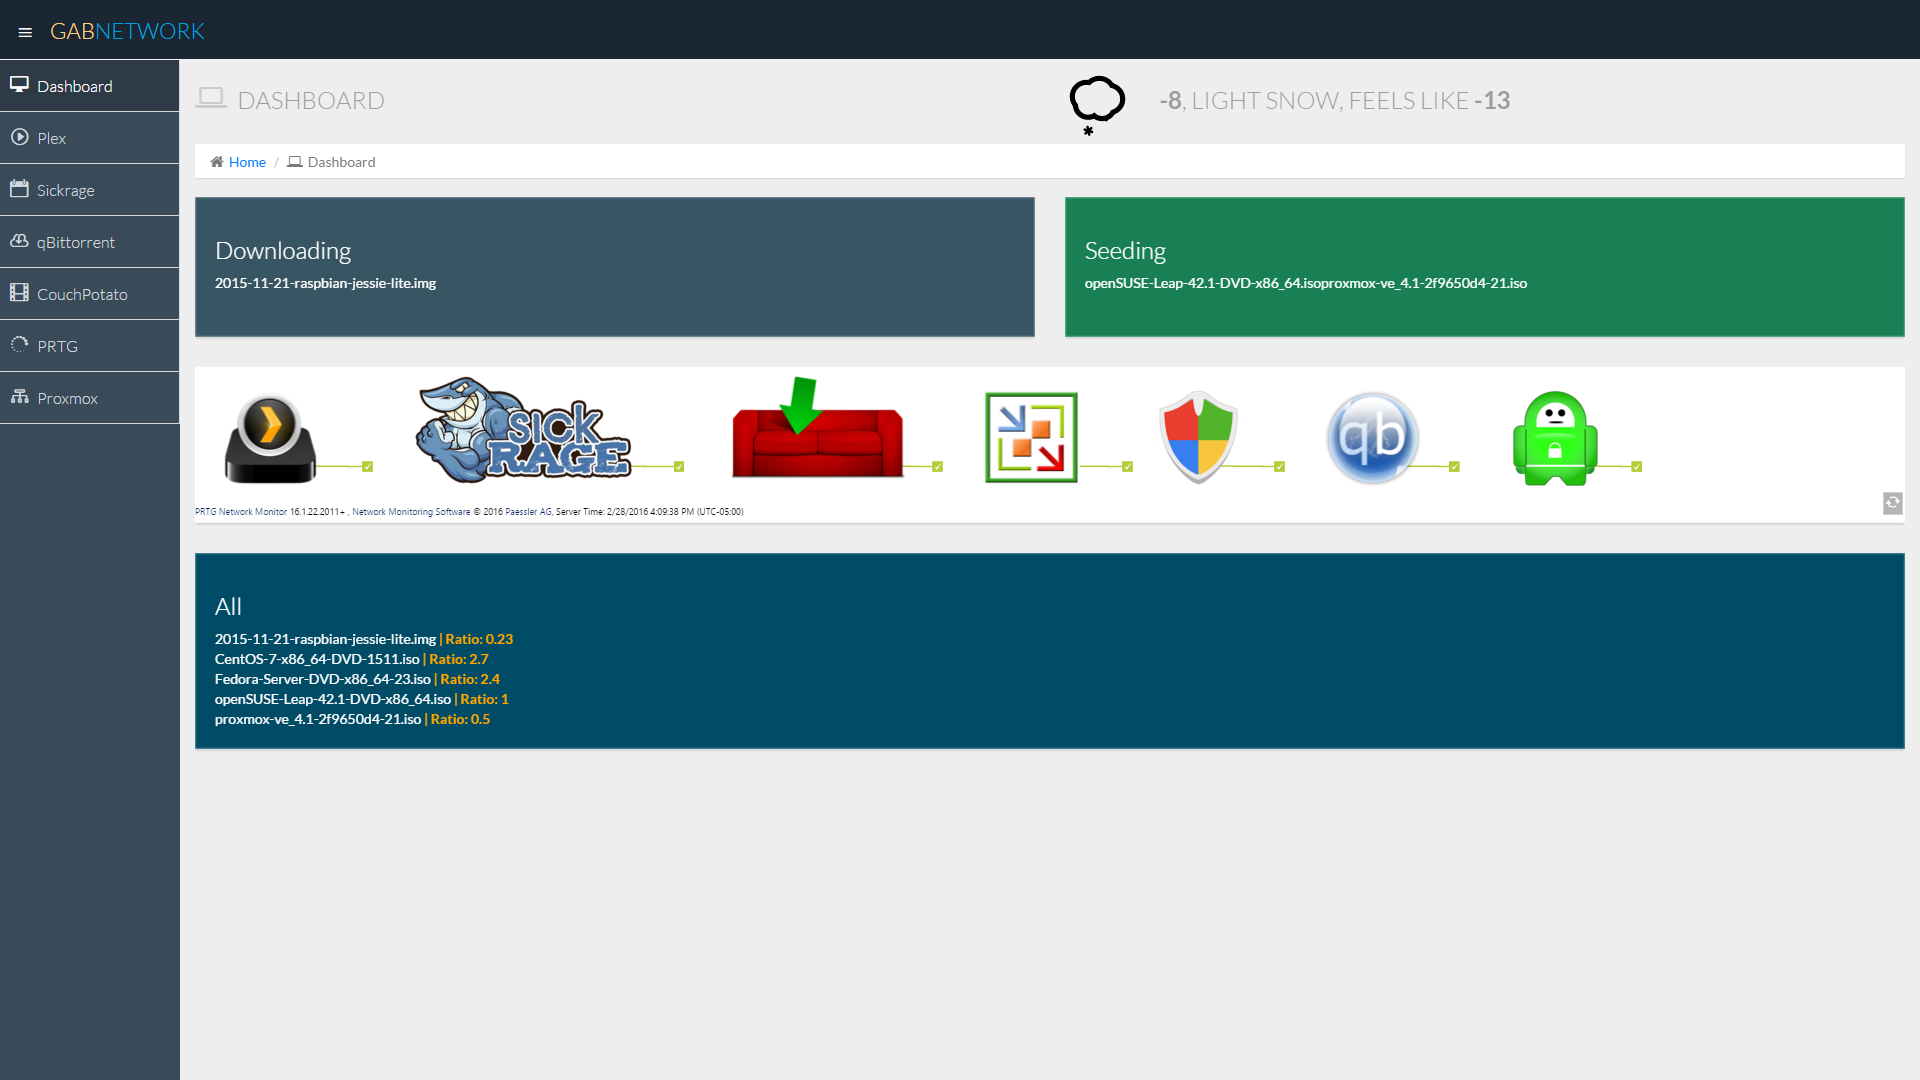
This dashboard was create by Gabisonfire and he has distributed it on Github here. He was very helpful in getting everything set up and hopefully we’ll see some of my modifications rolled into his code soon.
Organizr
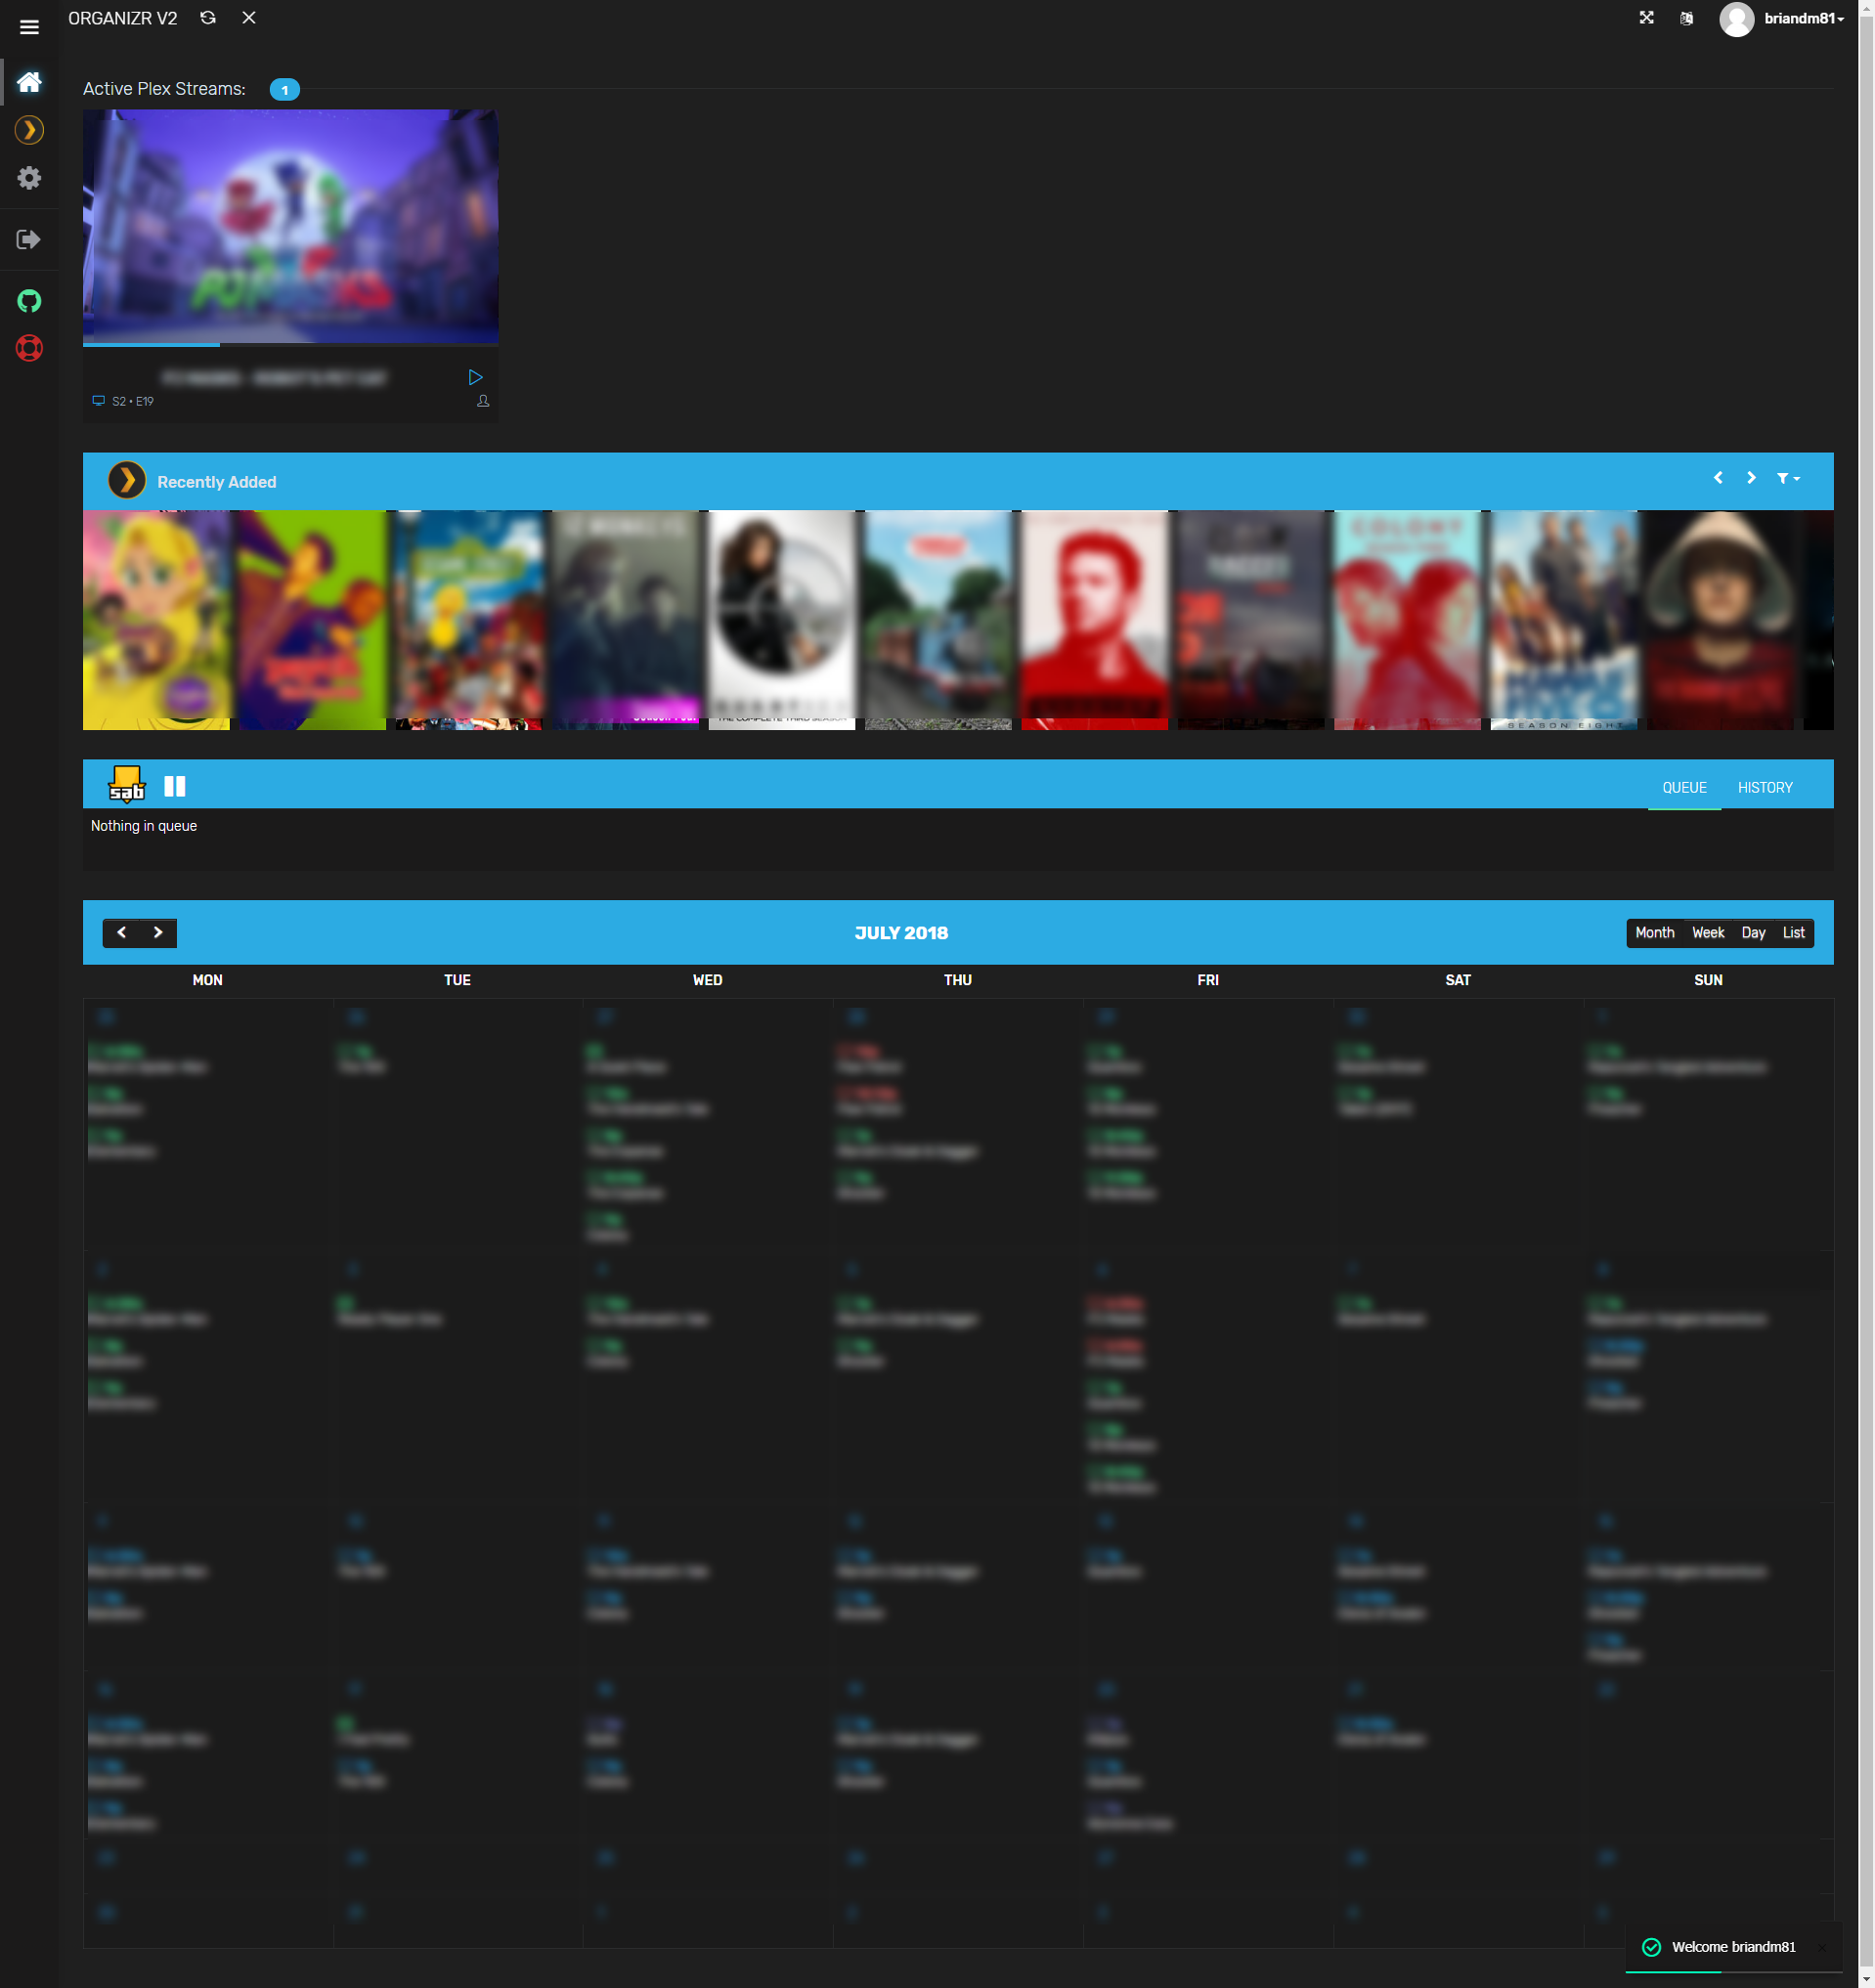
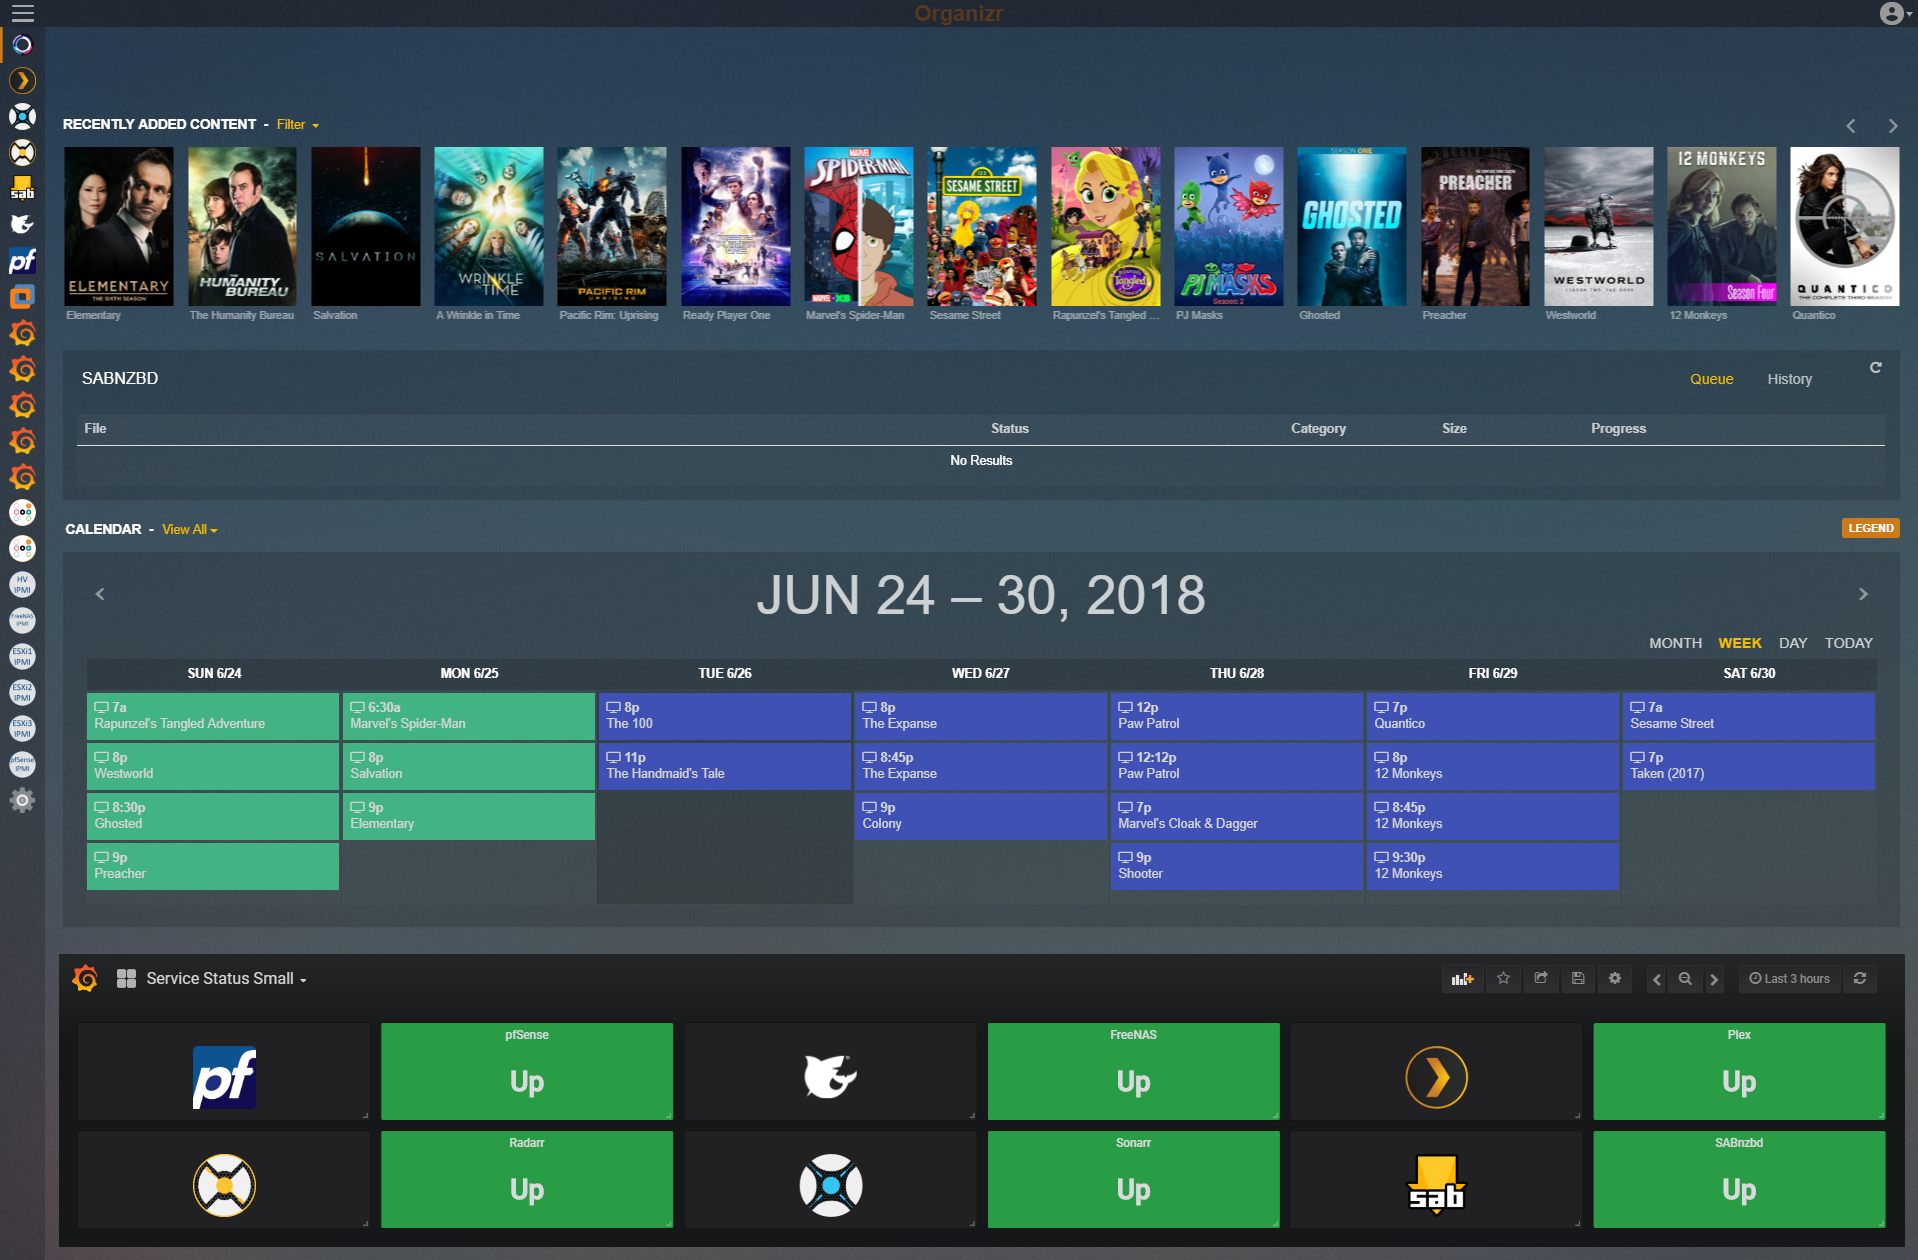
I really enjoyed working with this dashboard and finally posted my results of working with it. Imagine my surprise when someone mentioned a piece of software in that post named Organizr. This is basically what I was using, but far more advanced. So next, I turned my attention to setting up Organizr and giving that a whirl. My attempt looks something like this:
Organizr Homepage
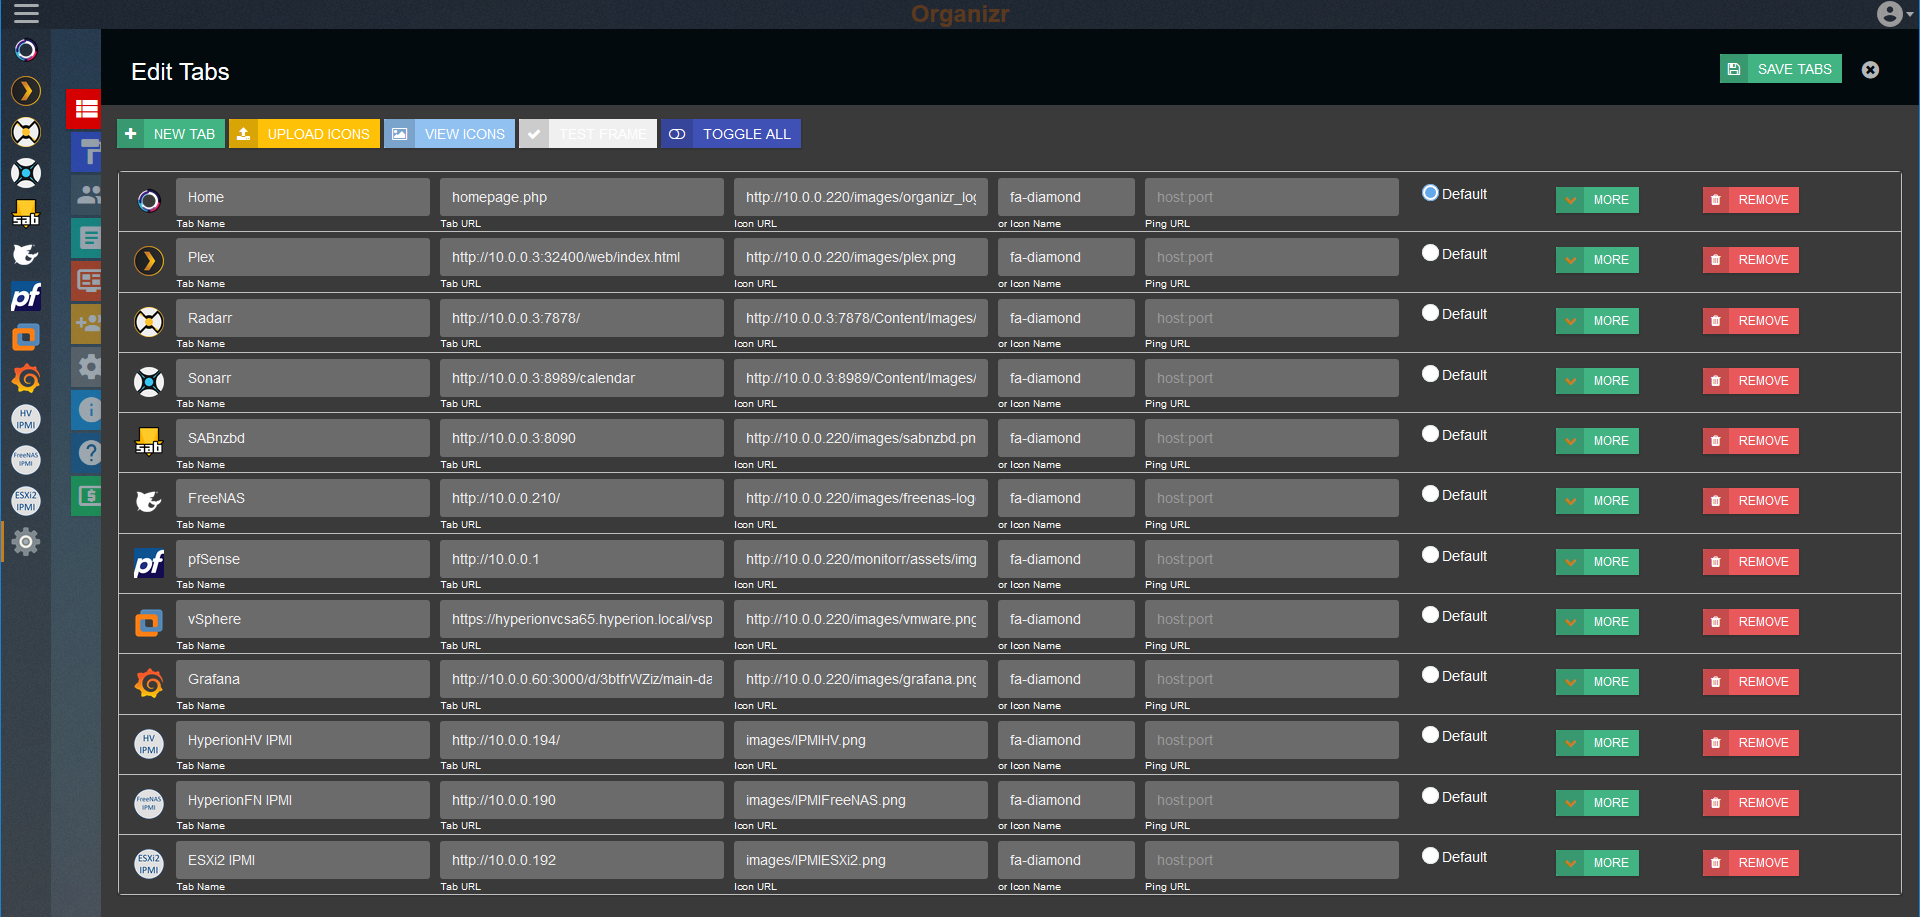
Nifty Admin Interface
Custom vs. Pre-Built
When it comes to the decision of custom vs. pre-built dashboard software, its a complicated answer for me. Let’s take a look at a few Pro’s and Con’s:
Organizr Pro’s
- Ton’s of pre-built integrations (Plex, SABnzbd, Sonarr, Radarr, etc.)
- User Management
- Really nice administrative interface
- Very Pretty
Organizr Con’s
- Much harder to tinker with (IE, play with the code)
- User Management (yes, this can be a con…its just one more thing for you to manage in your homelab)
Custom Pro’s
Infinite flexibility to tinker
I still prefer the look of the option I selected over Organizr
Custom Con’s
Way less pre-built integrations
Less refined administrative interface
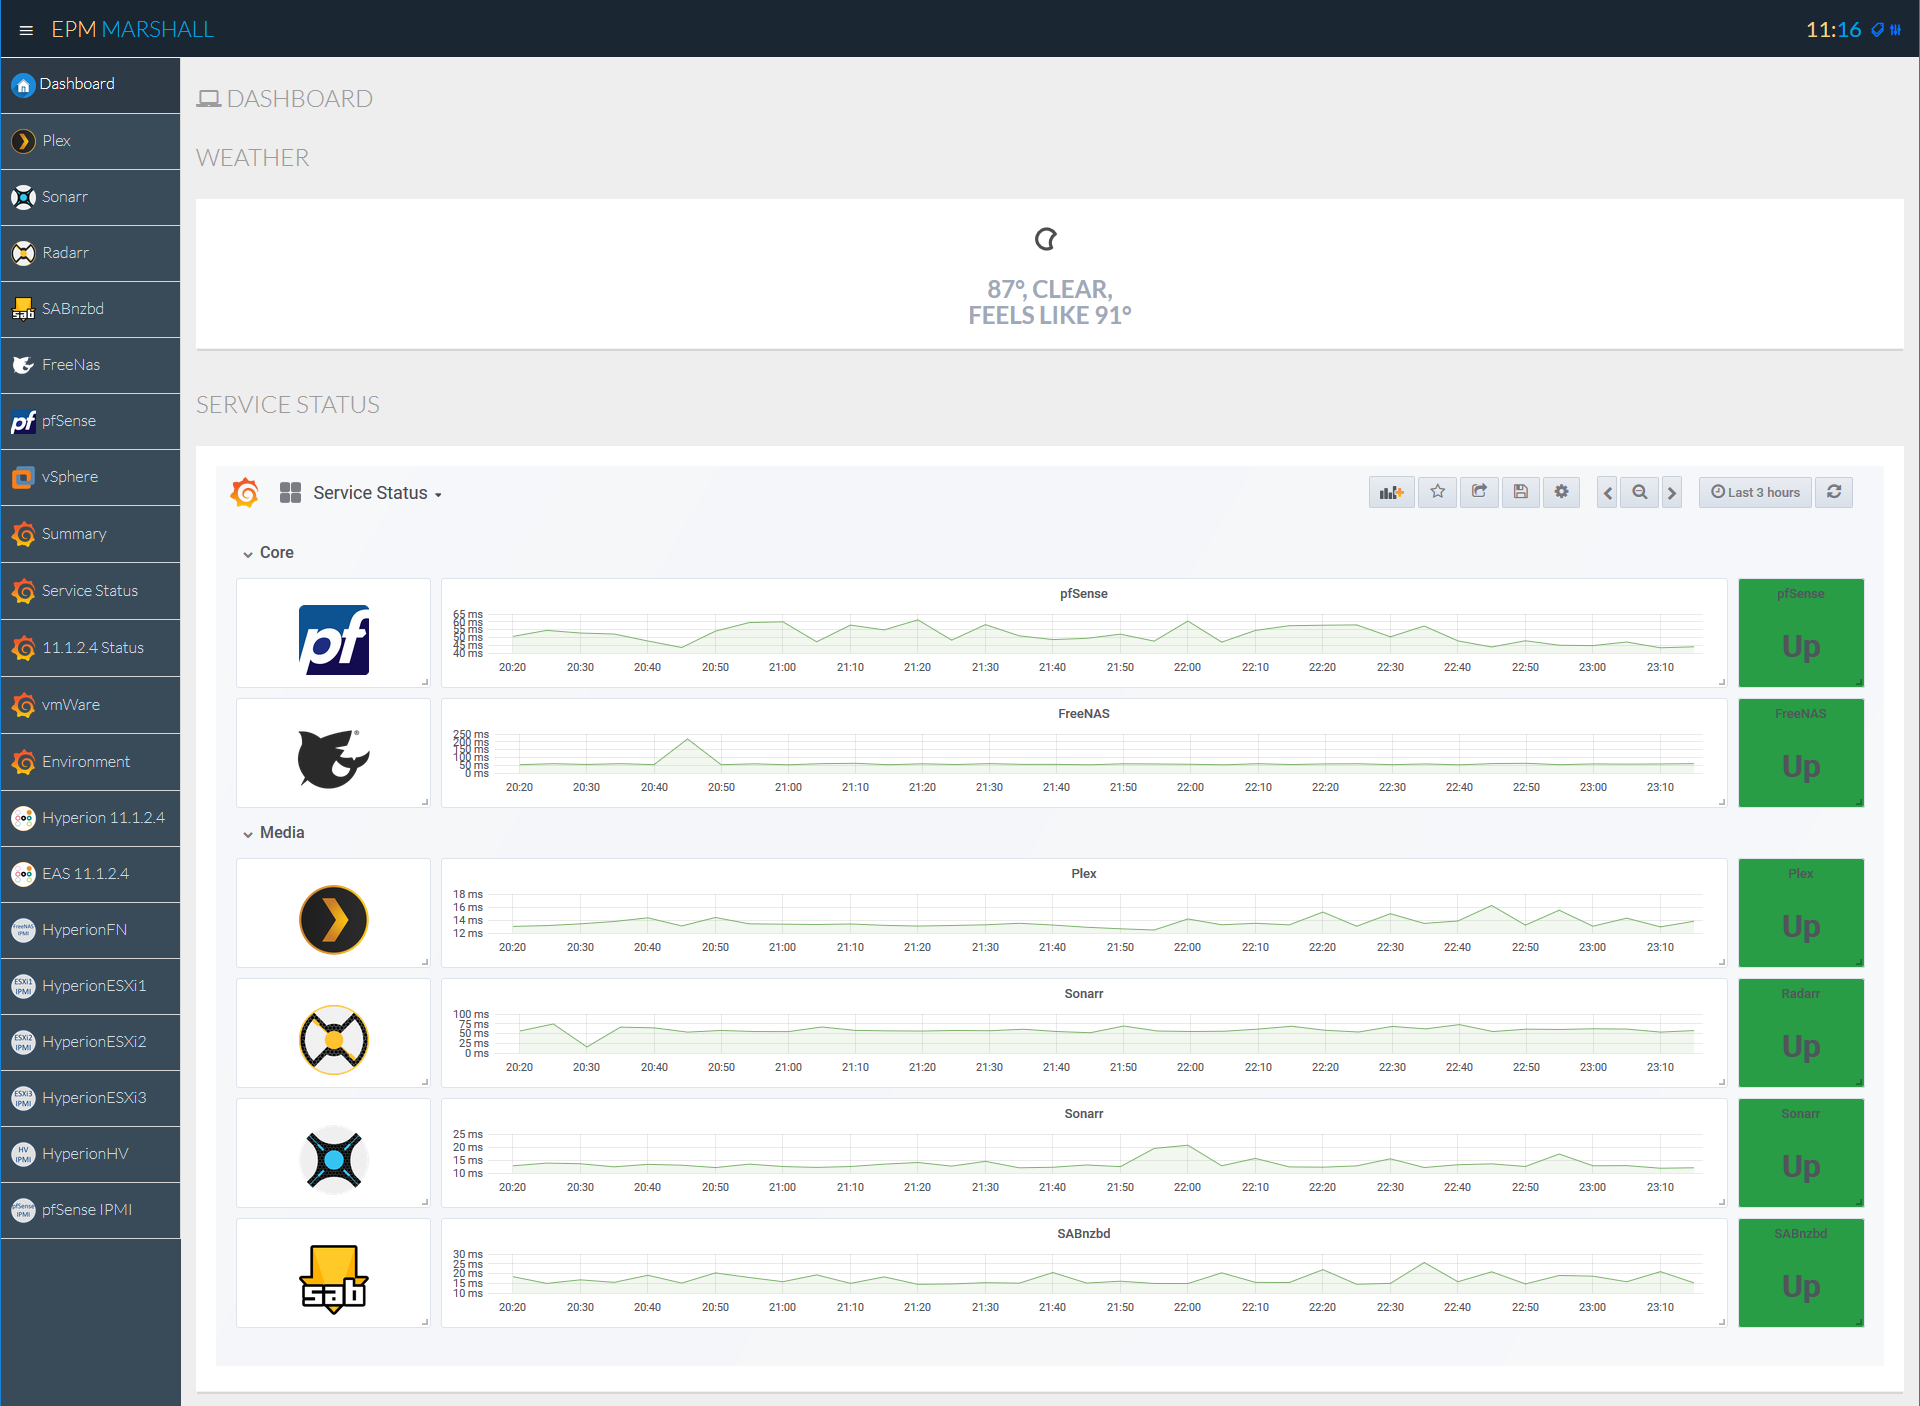
My Homelab Dashboard
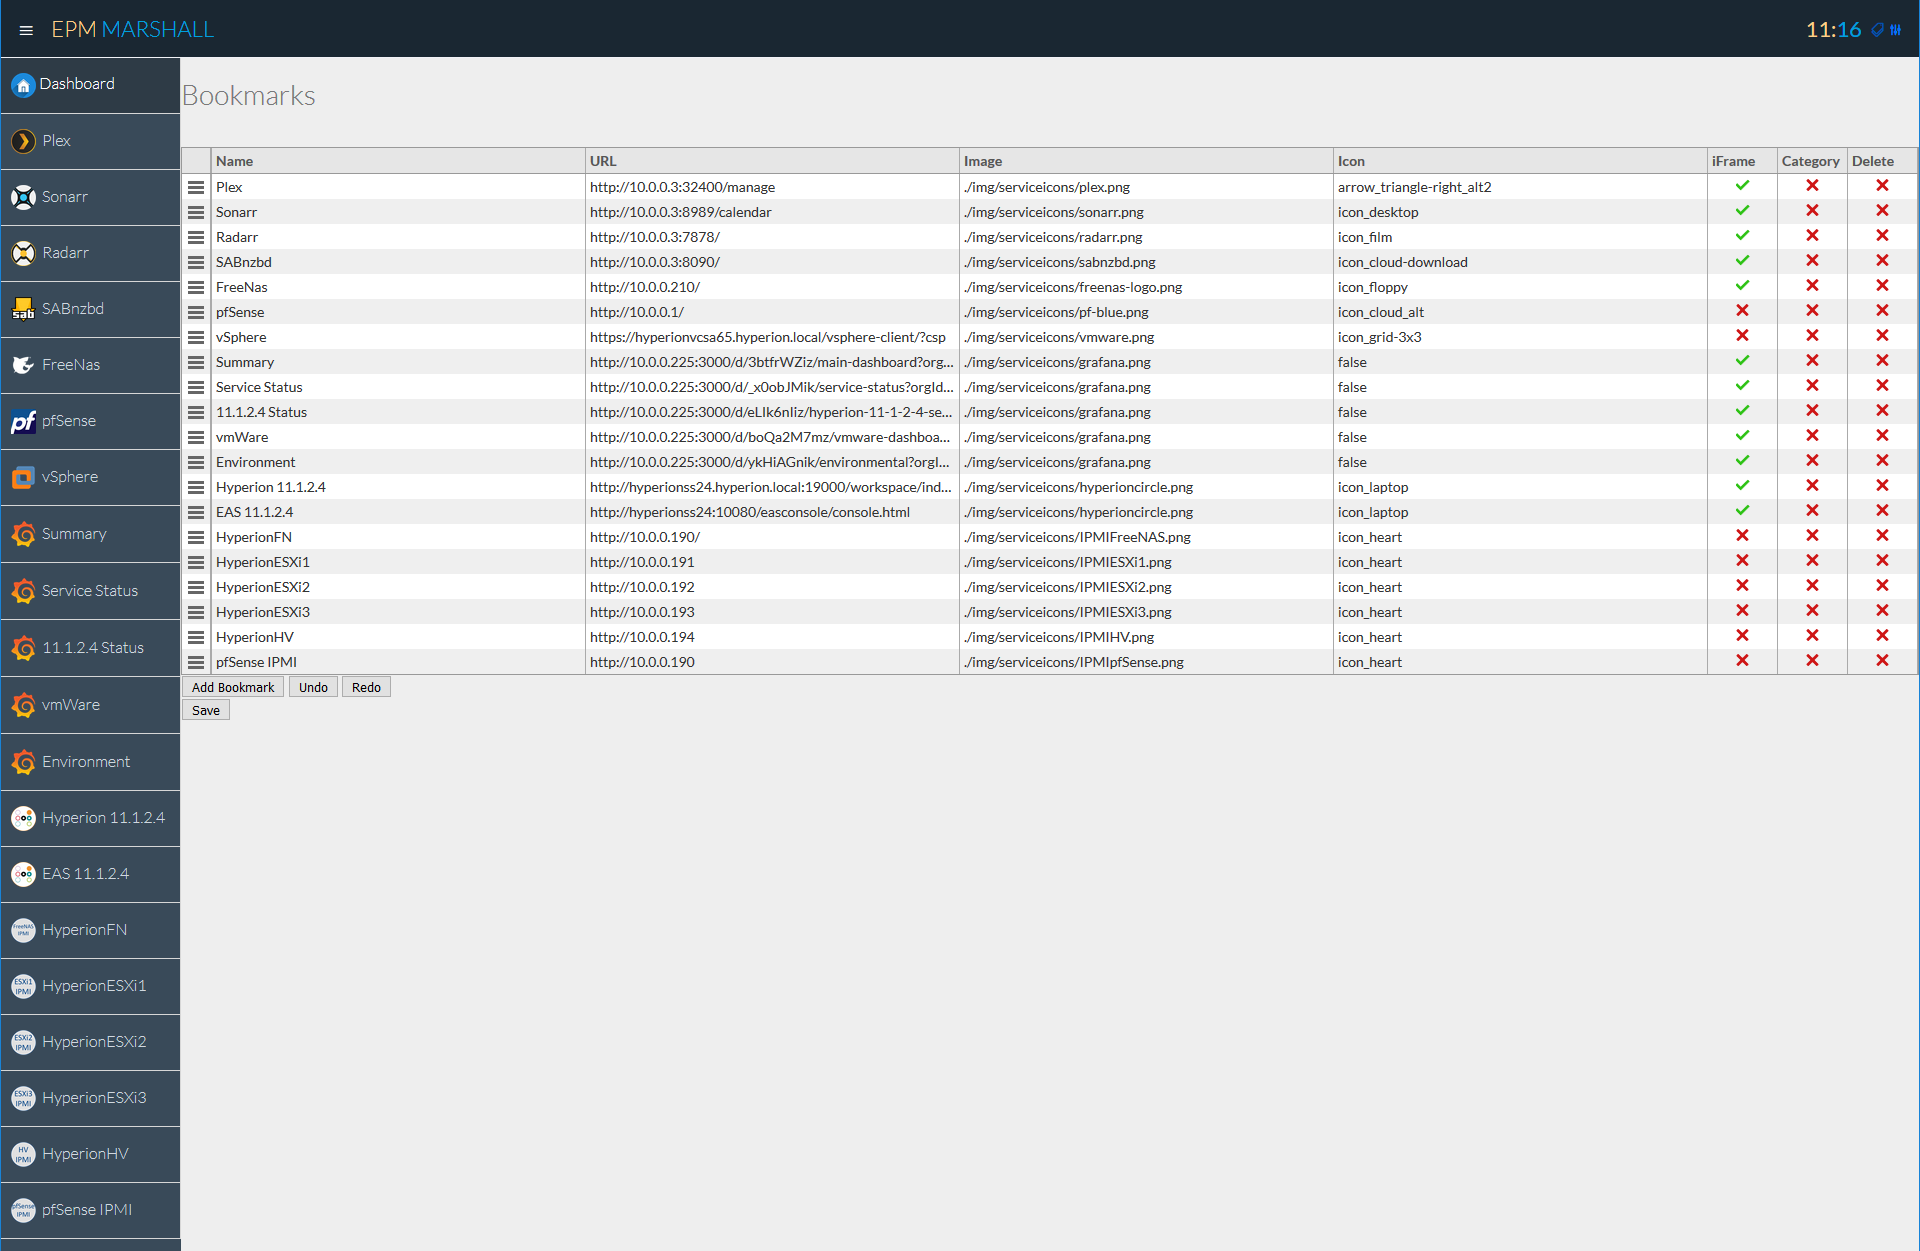
In the end, I have both up and running and will likely build tutorial for both. At the moment, I still prefer the custom dashboard, and I’ve gone through and extended it quite a bit with logos on the interface and a brand new administrative engine. Take a look:
Custom Homepage
New Admin Interface
Grafana Fun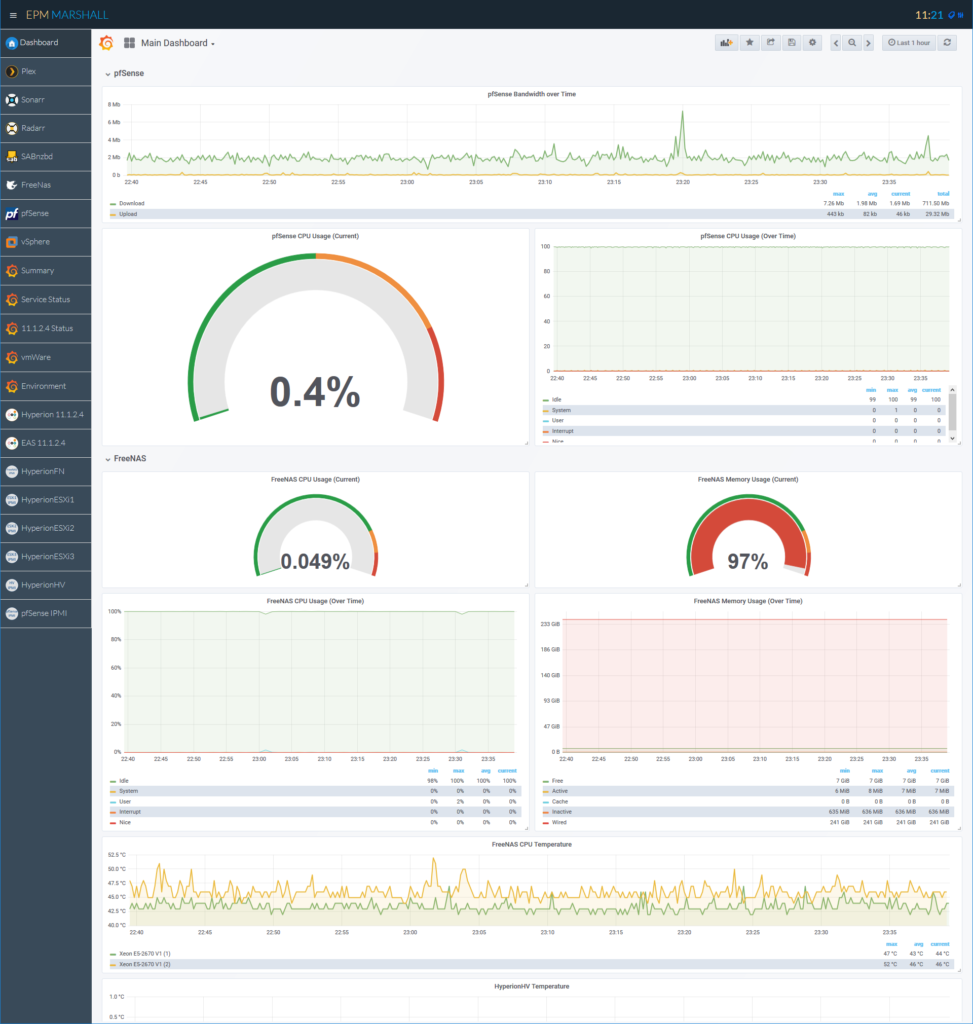

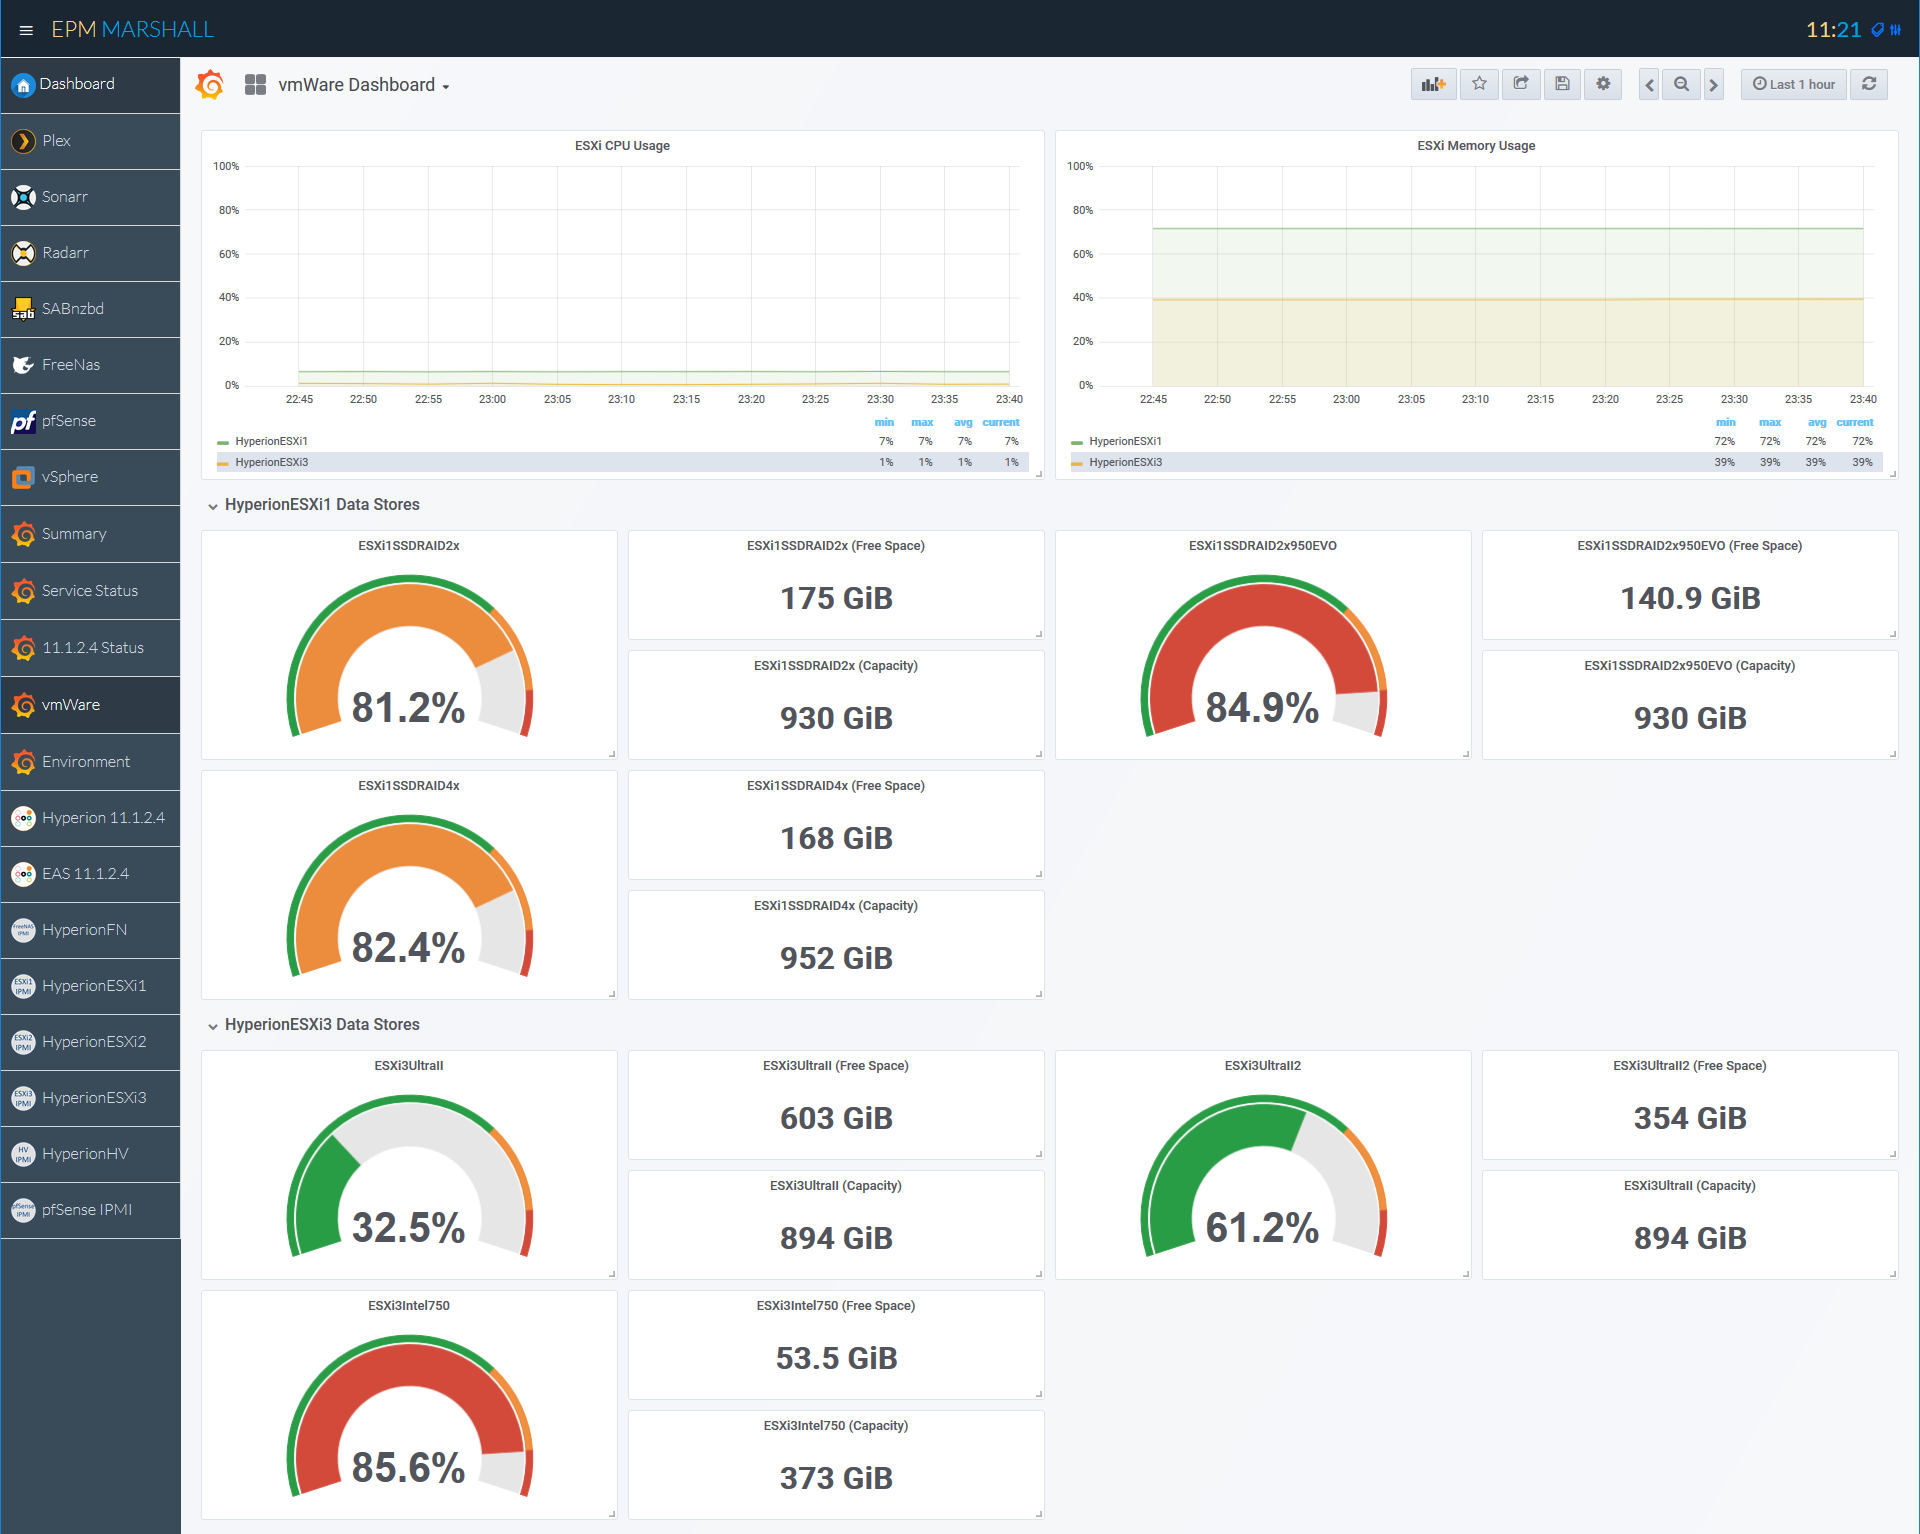
More Grafana Fun
The TIG Stack
Hopefully you are looking at my dashboard saying…”That’s really cool. What else does it take to do that?” If you aren’t saying that, keep it to yourself and let me live in ignorant bliss. So what else does it take? Enter the TIG stack. Telegraf, InfluxDB, and Grafana. These are three open-source projects that make all of the really cool visualizations possible.
Telegraf
Telegraf is an open-source product with a ton of plug-ins that gives us the ability to write statistics to a database on an interval. For instance, it might look at the CPU usage on a server and then write that to a database every 30 seconds. The Telegraf agent will track all types of things like CPU and memory usage, SNMP metrics, and anything else you can write a plug-in for. But what kind of database does it write the data to?
InfluxDB
InfluxDB is from the same development team as Telegraf. It is also open-source and provides a streaming database specific to time-based data. This means telegraf and anything else that can stream to a web-service can write to InfluxDB. Once you have InfluxDB configured and Telegraf sending data, you can move on to making pretty pictures with Grafana!
Grafana
What good is a homelab dashboard if you can’t make pretty pictures? Exactly, And this is where Grafana comes in. Grafana is yet another open-source piece of software, this time geared towards the actual dashboarding part of a homelab dashboard. Basically, it can take anything from InfluxDB and make it pretty (and useful).
PowerShell
I guess the P is silent? For all of the things that Telegraf can’t handle natively, I have a bunch of custom PowerShell scripts that give us statistics. This includes things like VMware and service status.
What’s Next?
As I already mentioned, I love blog series. We’ll have at least one blog post dedicated to every step in the process of building your own homelab dashboard. In an ideal world, this will be a soup-to-nuts solution for anyone looking for pretty graphs and a central location to management their homelab.
(DreamHost Test Note)
Nice intro to the series. I look forward to your next installment!
Will you be posting your code for your custom dashboard on something like GitHub?
I can. I was hoping the originator of the code would update his so I wouldn’t end up with a fork. I’ll see what I can do.